The time periods are different but that doesn’t account for the difference in the results they reported.
Actually, since weather goes up and down all the time, time periods
do account for a difference, especially when they’re too short. That’s the take-home message of both that video
and the NOAA report.
But more importantly, NOAA were trying to remove the effect of ENSO. Jones was asked about
his global temperature record. If he tried to change the subject and mention something about ENSO corrections you can
guarantee that “skeptics” would have been all over him for trying to avoid answering the question.
First, ENSO should have been removed from Jones’ data since cyclical events have no bearing on whether global warming is occurring.
Actually, Jones published a very interesting paper on what the temperature trend looks like if you remove known forcings with reasonable physical parameterisations, and, sure enough, when you remove extraneous factors you make the signal:noise ratio of the climate stronger and easier to see that yes, it has in fact kept climbing steadily.
But that requires physical
modelling and
parameter estimation, which is like a red flag to a bull to certain people.
But the bottom line is that HadCRUT is supposed to be reporting global temperature anomaly and Jones was asked
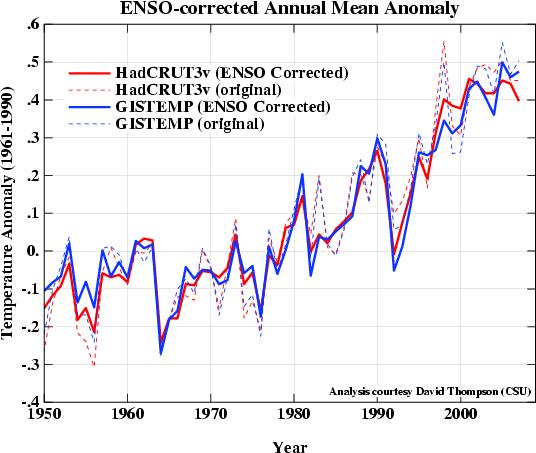
about his global temperature anomaly. It would have been inappropriate for him to start talking about ENSO, which actually makes the trend appear more clearly:

Note how it knocks off the unusually high peak of 1998? And, if you filter out the effect of Mt Pinotubo in 1991, the line becomes
even more straight.
If people don’t trust scientists to account for these other effects, then the only way to filter out their impact
is to take longer time periods, because measurements show that ENSO, volcanoes, and the sun have had no long-term trend in the recent past, you can eliminate their effect if you average over a long enough period of time.
This would have cut his supposed trend by about half and is just another example of disingenuousness: how can one justify including in a trend calculation something that by definition cannot be part of a trend? Second, even without the ENSO effect it isn’t at all clear that his “trend” exists given that for the last two thirds of the period in question the trend has been exactly zero.
I’m sorry, but I think you completely misunderstand the situation.
Firstly, you can’t just “correct for ENSO”. You have to use a physically-plausible parameter estimation technique to come up with a reasonable ENSO correction. (You
can just use a statistical technique like Tamino did but then people will complain “it’s just statistics”.) Given that people
already don’t trust scientists to homongenise thermometer readings, do you
really think they’ll be happy if they “correct” for ENSO, etc., before releasing the “corrected” temperatures onto the public?
(The huge irony of all this, of course, is that if you
do apply those corrections then the
global warming signal is stronger! Then everyone will say the global warming trend is because of bogus corrections for ENSO!)
Secondly, HadCRUT is a
temperature record. If other researchers want to experiment with different ways to try and filter out the effect of ENSO, they can. This is a
better scenario because different people mgiht have different ideas about the best way to do it, and everyone can see what’s going on. This is actually an active area of research.
It is certainly not “disingeneous” to publish a temperature anomaly record that is, in fact, exactly that – a temperature anomaly record.
And, thirdly, you’re working off a false premise – that Jones’ “15 year trend” would be “cut in half” if ENSO-correction was applied, based on the effect of the 10 year trend 1999-2008. I think you’ll find that correcting for ENSO over the
15 year time period actually makes the trend
more certain, not less. Look
very carefully at the graph I posted above and see what happened in the years 1995-1999 when ENSO-correction is applied. What do you think the slope of the trend 1995-2008 will be compared to 1999-2008 using the
ENSO-corrected data?
Thanks. You sent me down completely the wrong path because you said “2009 annual State of the Climate report” when in fact it is their
2008 report. So the dates are even more wrong than you thought.