A third of the world now faces deadly heatwaves as result of climate change

  • Thread starter Thread starter lynnvinc
  • Start date Start date
Status
Not open for further replies.
From the same source, these “climate changes” in Missouri are random.

The Century’s Statistics
Warmest Temperature - 118°. July 14, 1954 in Warsaw and Union
Coldest Temperature - 40°. February 13, 1905 in Warsaw
Driest Year - 1953. State average total precipitation: 25.53"
Wettest Year - 1993. State average total precipitation: 56.90"
Warmest Summer - 1934. State average temperature: 81.9°
Coldest Winter - 1978-79. State averahe temperature: 24.1°
 
“A third of the world now faces deadly heatwaves as result of climate change: Study shows risks have climbed steadily since 1980, and the number of people in danger will grow to 48% by 2100 even if emissions are drastically reduced” at theguardian.com/environment/2017/jun/19/a-third-of-the-world-now-faces-deadly-heatwaves-as-result-of-climate-change
Dear Lynn,

Thank you for posting the article. I like to caution folks that even with the best intentions, popular media accounts of science articles often portray the science inaccurately. Thankfully, though it has regrettably been less true in the past, print media has become much better at linking the article they’re publicizing.

Fortunately, the associated paper, Global risk of deadly heat, is available in full at the link provided.

Summary findings are given in the abstract.

[We] identified a global threshold beyond which daily mean surface air temperature and relative humidity become deadly. Around 30% of the world’s population is currently exposed to climatic conditions exceeding this deadly threshold for at least 20 days a year. By 2100, this percentage is projected to increase to ∼48% under a scenario with drastic reductions of greenhouse gas emissions and ∼74% under a scenario of growing emissions.

More briefly, the population exposed to the authors’ threshold of temperature and humidity for 20 days or more a year is expected to grow from 30 percent to somewhere between 48 percent and 74 percent depending on how CO2 emissions change.

Readers should also note that newly published results, even in high quality journals, should be afforded less weight than results that have had more time to attract critical review.
By 2100, I predict that upwards of 99% of current CAF posters will be dead. I bet my prediction is more reliable than theirs.
Dear uc,

If you’re offering odds … :cool:
The US has been reducing CO2 emissions, significantly, but apparently, that’s not good enough …]
Please forgive me for snipping your larger concern from this posting.

While the US has slowed its growth in CO2 emissions, we have not yet begun to reduce them. It’s always difficult to say if actions are good enough. It is more clear, however, that we can do better, and that any reduction, even in the rate of CO2 emissions, will be helpful in limiting the amount of warming we are currently expecting due to our modern reliance on fossil fuels.
Given that global temperatures have hardly moved in nearly 20 years …]
Dear Ender,

While there was a slowing in the rate of surface temperature increases following the El Niño cycle around 1997 that created the record temperatures of 1998, it’s fairly well established that much, and perhaps most of the excess heat was taken up in the Pacific.

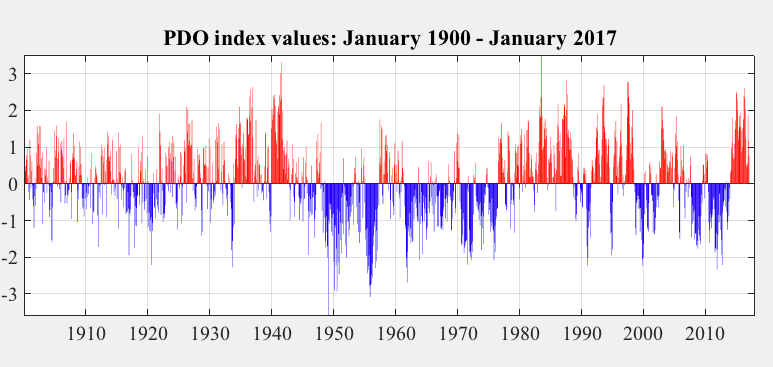
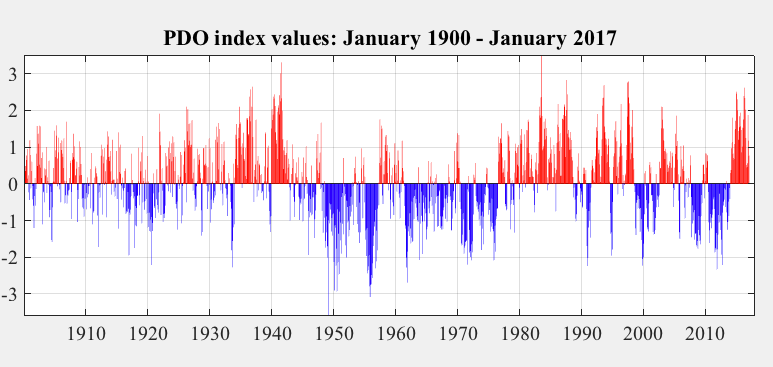
With its release in the latest El Niño cycle, we’ve once again returned to record surface temperatures, including the past three years in a row. This El Niño Southern Oscillation (ENSO) works in tandem with the Pacific Decadal Oscillation (PDO) to alternately store and release heat across, well, decades, which is why one should be especially cautious about reading too much into alterations in temperature increase over shorter periods of time.

The facts are that the models have significantly overestimated the amount of warming we have experienced so far in this century, a fact finally getting “official” recognition. This is from a paper that came out about two days ago:
  • We conclude that model overestimation of tropospheric warming in the early twenty-first century is partly due to systematic deficiencies* in some of the post-2000 external forcings used in the model simulations.
    Ender
Again, one should be careful about drawing too much from recently published results, and in this case, I suspect the source that publicized this result was less careful than most. If it’s not too much trouble, would you mind letting me know how you came across this paper?

I note this paper is directed toward satellite-derived models, which have proven notoriously difficult to calibrate, naturally enough, as any attempt to measure tropospheric temperatures from beyond the stratosphere is bound to encounter more issues than simply reading the results from surface stations.

That said, satellite-derived models have been greatly improved over the past couple of decades as a result of papers such as this, and the introduction of data from improved satellites launched over the years.

In the meantime, we have the more reliable surface-station derived temperature models, not addressed in this article.
It’s interesting that you chose a non-peer reviewed article in a pay to publish journal and that costs $175 to read. One can only wonder how many scientists will cite such article for any scientific value it may contain.
Dear frobert,

Please allow me to correct you to some extent. The article offered by Ender is both peer-reviewed, and published in a reputable journal. In fact, with an impact factor of nearly 14, it’s considered a highly respected journal.

That said, I heartily agree that our current scientific publishing industry is in great need of repair, as indicated by the absurd prices attached to individual articles. But you’ll find that these articles can be retrieved without cost by speaking to your local librarian about inter-library loan or if it’s convenient, by visiting the relevant department of a local university.

As ever, Jesse

 
It’s interesting that you chose a non-peer reviewed article in a pay to publish journal and that costs $175 to read. One can only wonder how many scientists will cite such article for any scientific value it may contain.
I don’t know how to tell if an article is peer reviewed or not, but frankly, Scarlett, I don’t really care. This “it’s not peer reviewed” clamor is just another way of saying “Ignore it and maybe it will all go away.” Santer, the lead author, is a heavyweight on the alarmist side. He was a researcher at the University of East Anglia’s Climate Research Unit, and was the convening Lead Author of Chapter 8 of 1995 IPCC Working Group I Report (AR2 WGI).

It is ironic that the side that complains most vocally about its opponents “ignoring the science” resorts to that approach as the first line of defense against any report that gets off message, even when it is presented by “their” scientists.

Ender
 
There is NOT a hole in the ozone layer.

There is a seasonal THINNING at the south pole ozone layer. However, the ozone layer is STILL thicker at the poles than at the equator.

Read “The Hole in the Ozone Scare” by Maduro.

After Dobson died in 1976, serious scholarship on the ozone layer stopped. After he died, people began ignoring seasonal ozone changes and changes in the ozone density as it varies by latitude.
Guess what, NASA has photos of it! Every year it opens up. You can call it seasonal thinning, whatever you wish, but its there, it opens up, it makes the sun in Australia a nightmare to be in these days.

You might want to consider NASA when stating things like this…

Straight from the NASA website

What is a Dobson Unit?
The Dobson Unit (DU) is the unit of measure for total ozone. If you were to take all the ozone in a column of air stretching from the surface of the earth to space, and bring all that ozone to standard temperature (0 °Celsius) and pressure (1013.25 millibars, or one atmosphere, or “atm”), the column would be about 0.3 centimeters thick. Thus, the total ozone would be 0.3 atm-cm. To make the units easier to work with, the “Dobson Unit” is defined to be 0.001 atm-cm. Our 0.3 atm-cm would be 300 DU.

What is the ozone hole?
Each year for the past few decades during the Southern Hemisphere spring, chemical reactions involving chlorine and bromine cause ozone in the southern polar region to be destroyed rapidly and severely. This depleted region is known as the “ozone hole”.
The area of the ozone hole is determined from a map of total column ozone. It is calculated from the area on the Earth that is enclosed by a line with a constant value of 220 Dobson Units. The value of 220 Dobson Units is chosen since total ozone values of less than 220 Dobson Units were not found in the historic observations over Antarctica prior to 1979. Also, from direct measurements over Antarctica, a column ozone level of less than 220 Dobson Units is a result of the ozone loss from chlorine and bromine compounds.

We can do pictures when I have time. Or just search NASA yourself

ozonewatch.gsfc.nasa.gov
 
I don’t know how to tell if an article is peer reviewed or not, but frankly, Scarlett, I don’t really care. This “it’s not peer reviewed” clamor is just another way of saying “Ignore it and maybe it will all go away.” Santer, the lead author, is a heavyweight on the alarmist side. He was a researcher at the University of East Anglia’s Climate Research Unit, and was the convening Lead Author of Chapter 8 of 1995 IPCC Working Group I Report (AR2 WGI).

It is ironic that the side that complains most vocally about its opponents “ignoring the science” resorts to that approach as the first line of defense against any report that gets off message, even when it is presented by “their” scientists.

Ender
Firstly apologies for reading century as country. I need glasses i think. Secondly i still believe those arguing against global warming are mostly countrycentric. Its a constant theme here.

Global warming and global climate change are different. The latter describes how we are heading into a new ice age, which we are.

The former describes how we are getting to frostys for everyone , faster than normal… Its inane to deny the anthropologic actions on the climate.

And while that strawman continues to be perpetuated, what hope has the poor old polar bear got but yo go extinct.

We are in the greatest global extinction event since the dinos, for a good reason. And it aint Noah!

Peer review is everything in publishing scientific work. Otherwise anyoone could talk out of his arse, and publish.

Multiple authors quoting 65 refs means nothing in legitimate work.

And has anyone here got access to, or read the conclusion to these articles people happily post the abstracts too?

I am happy to copy and paste the conclusions if any one wishes. The conclusions are incredibly important.

Smacks of commercialism to me.

You got one guy who is a great researcher, well what is the conclusion he came too?

If anyone doesnt know if their article is peer reviewed, yell out. I will find out.
 
While there was a slowing in the rate of surface temperature increases following the El Niño cycle around 1997 that created the record temperatures of 1998, it’s fairly well established that much, and perhaps most of the excess heat was taken up in the Pacific.
I don’t think this assertion is accurate, if for no other reason than there is insufficient data to support such a claim. Yes, I am aware that this has been presented as an explanation, but it is nothing like being “fairly well established.” It is a speculative attempt to explain why the real world does not behave like the models predict.
With its release in the latest El Niño cycle, we’ve once again returned to record surface temperatures, including the past three years in a row. This El Niño Southern Oscillation (ENSO) works in tandem with the Pacific Decadal Oscillation (PDO) to alternately store and release heat across, well, decades, which is why one should be especially cautious about reading too much into alterations in temperature increase over shorter periods of time.
I don’t know whether this is accurate or not, but there are clearly serious scientists who have alternate hypotheses. Nor is it clear that there is anything at all unusual going on.over the time period analyzed [1959/1979 - 2015]*, these natural factors have involved historically quite normal solar, volcanic and ENSO activity.
*After calculating the effects of those natural factors this report concluded:
*there is no Natural Factor Adjusted Warming at all.
*That is, all of the warming we have experienced for at least the last half century is natural and has nothing whatever to do with CO2. Are they right? I have no idea, but it will take more than “It’s not peer reviewed, ignore them” to convince me.
Again, one should be careful about drawing too much from recently published results, and in this case, I suspect the source that publicized this result was less careful than most.
Why would you suspect that, and why is there more attention paid to the publisher than to the contents of the article?
If it’s not too much trouble, would you mind letting me know how you came across this paper?
Given that it was authored by a leading light on the MMGW side it gained a lot of attention as soon as it came out. I think I saw it first on the Watts Up With That web site. Why?

Ender
 
Roseeurekacross. You mentioned . . .

But I have just the opposite. I have things that used to grow here but it is now too cold.

When I bring THAT up, I get told that’s merely a local phenomenon.

So concerning your “proof” of " tropical fruit growing in traditionally temperate climates." from what the global warming alarmists have taught me, I have to say . . . .
Cathoholic, what people dont read, maybe because the science is too difficult for them, i dont know, is that with global climate change, some places are going to have a nifty mini ice age. And yes temperatures will be much colder locally.

Agriculture is all about adaption these days. You adapt different species, or your crop fails, you go broke, sell the farm, wander aimlessly around the city writing acolyptic scripts for Hollywood.

We just solved a grain grower problem here that means beer is safe well into the coming ice age !

Its climate in the shift in global temperature zones. They are moving.

Ask a grape grower! Its a bonus for some varieties
 
Still waiting for just 1 alarmist to quit singing from the hymn sheet and argue for western countries to wholeheartedly switch to nuclear power.

This proven technology at a stroke would -----> Drastically decrease carbon dioxide output (sorry plant life), provide cheap reliable energy supply, and cause a drop in world oil prices which drastically helps third world nations.

But then as a Chinese Malaysian once explained to me, government is about managing problems, not solving them.

(or as many suspect, creating or imagining problems first so as to manage them).
 
Denying the validity of unsupported claims is not denying science. Given that global temperatures have hardly moved in nearly 20 years, why would we believe heatwaves are suddenly a new problem?

The facts are that the models have significantly overestimated the amount of warming we have experienced so far in this century, a fact finally getting “official” recognition. This is from a paper that came out about two days ago:
  • We conclude that model overestimation of tropospheric warming in the early twenty-first century is partly due to systematic deficiencies* in some of the post-2000 external forcings used in the model simulations.
    Ender
And here’s what I posted on the thread about that article:

Just remember they are talking about satellite tropospheric measurements, not surface temps, which are the main temps used to calculate GW. There could be all sorts of issues here, and it doesn’t in any way indicate GW has stopped.

Above the troposphere (that has the GH “belt” and is warming) is the stratosphere, which is cooling because less energy is escaping earth due to the greenhouse effect. I think I’ve also read that the stratosphere and troposphere are descending in some parts of the world (I think they said the tropics, nearer the equator), so it is possible some stratosphere cooler temps have been mixed in. I know that has happened in the past.

The abstract concludes with “We conclude that model overestimation of tropospheric warming in the early twenty-first century is partly due to systematic deficiencies in some of the post-2000 external forcings used in the model simulations.” They don’t say what the external forcings are (solar irradiance, volcanic eruptions, GHGs, etc), so it is unclear what the problem is. [They also did not indicate whether or not the instrumental measurements showed warming, only that the models had shown more warming.]

Since we have to pay for the article, I’m not sure if these factors are mentioned or have been carefully controlled for, but I will wait for some real climate scientists to explain this article in lay terms and NOT rely on Breitbart [note: the OP of that thread relied on Breitbart’s interpretation of the article], which seems to be a very bad place for getting information and facts.

As for observational, instrumental data to date, the warming continues, but it is unclear what this article means for future projections.
 
That’s the kind of thinking that leads to Scalise. “Deniers” won’t listen to reason, which only our side has, so we have to get rid of them…
Way to demagogically attribute something to me that I didn’t remotely say.
 
…While there was a slowing in the rate of surface temperature increases following the El Niño cycle around 1997 that created the record temperatures of 1998, it’s fairly well established that much, and perhaps most of the excess heat was taken up in the Pacific.

With its release in the latest El Niño cycle, we’ve once again returned to record surface temperatures, including the past three years in a row. This El Niño Southern Oscillation (ENSO) works in tandem with the Pacific Decadal Oscillation (PDO) to alternately store and release heat across, well, decades, which is why one should be especially cautious about reading too much into alterations in temperature increase over shorter periods of time…
Here is a chart that controls for these other factors – el ninos and la ninas (which Hansen refers to a sloshings in the system) – and gives a very good time frame of 50 years, which much better shows the pattern of warming (than simply picking a very warm year, followed by a less warm year to indicate a trend):

https://www.skepticalscience.com/graphics/ENSO_Temps_2015_500pix.gif
 
Hopefully this chart based on NASA data from 1880 through 2016 will put to rest the idea that GW has somehow stopped. Even most skeptics agree it is happening, and in fact it looks like it’s accelerating (hopefully not):

(Please Note: This uploaded content is no longer available.)

Note 1998 was quite warm – a super-el-nino year – but not nearly as hot as 2016.
 
And here’s what I posted on the thread about that article:

Just remember they are talking about satellite tropospheric measurements, not surface temps, which are the main temps used to calculate GW. There could be all sorts of issues here, and it doesn’t in any way indicate GW has stopped.
There are problems with taking historical surface temperatures as the guide and so many claim the atmospheric readings are more reliable.

Firstly as places develop and become more populated over the years the heat signature goes up in ways that has little to do with carbon dioxide emissions.

Secondly, the historical surface readings are not like simply measuring a piece of string. They are adjusted (and sometimes ignored). This is done, it is claimed, to account for certain factors. What many people are saying is that one of the main factors is to produce results which show warming due to monetary considerations and partisan politics.

Christopher Booker discussing published temperature graphs

[Andrew Bolt discussing Michael Asten’s (a retired professor of geophysics) suggestions about temperature consensus.](Michael Asten, a retired professor of geophysics)

John Bates, former member of NOAA discussing data integrity.

At the very least you should understand this is not a rejection of science or a willingness to kill millions of people through climate. It is though a rejection of the blind acceptance of the integrity of the academic Left which dominates universities and government ‘scientific’ cartels where much of the ‘research’ is carried out.

If you are truly passionate about CC as a real pressing concern perhaps you should look to challenge the liberal Left’s take over of academia and their trashing of the reputation that has resulted in the dismissive attitude towards the institution’s they dominate by a large section of society. (and while we are at it, our field of education as well).

Oh, and you should at least discuss the possibility of nuclear energy as a unifying force that will stop emissions, end arguments regarding interpreting data, and end arguments of people being in the service of either authoritarian government ideology or in the pay of evil polluting oil companies.
 
Guess what, NASA has photos of it! Every year it opens up. You can call it seasonal thinning, whatever you wish, but its there, it opens up, it makes the sun in Australia a nightmare to be in these days.

You might want to consider NASA when stating things like this…

Straight from the NASA website

What is a Dobson Unit?
The Dobson Unit (DU) is the unit of measure for total ozone. If you were to take all the ozone in a column of air stretching from the surface of the earth to space, and bring all that ozone to standard temperature (0 °Celsius) and pressure (1013.25 millibars, or one atmosphere, or “atm”), the column would be about 0.3 centimeters thick. Thus, the total ozone would be 0.3 atm-cm. To make the units easier to work with, the “Dobson Unit” is defined to be 0.001 atm-cm. Our 0.3 atm-cm would be 300 DU.

What is the ozone hole?
Each year for the past few decades during the Southern Hemisphere spring, chemical reactions involving chlorine and bromine cause ozone in the southern polar region to be destroyed rapidly and severely. This depleted region is known as the “ozone hole”.
The area of the ozone hole is determined from a map of total column ozone. It is calculated from the area on the Earth that is enclosed by a line with a constant value of 220 Dobson Units. The value of 220 Dobson Units is chosen since total ozone values of less than 220 Dobson Units were not found in the historic observations over Antarctica prior to 1979. Also, from direct measurements over Antarctica, a column ozone level of less than 220 Dobson Units is a result of the ozone loss from chlorine and bromine compounds.

We can do pictures when I have time. Or just search NASA yourself

ozonewatch.gsfc.nasa.gov
Guess what!

Ozone is invisible.

The DU was not used until well after Dobson died.

The first time that South Polar ozone was measured was during the IGY … International Geophysical Year … and it showed a definite seasonal reduction followed by a seasonal increase.

We also already know from Gordon Dobson’s 1963 and 1968 publications that the “Ozone Hole” is natural. First measured in 1956, not 1975 or 1985, seasonal fluctuations of the “Ozone Hole” have always been there.

In 1963, Gordon Dobson (1889 - 1976) wrote “Observing the Atmosphere”. He covered temperature, ozone {1} (including global anomalies), solar activity, ionosphere, aurora, Van Allen belts, and magnetic field {5}. It ws partly an effort to describe what had been learned during the celebrated IGY (International Geophysical Year) … July 1957 thru December 1958 … for which Dobson built 100 ozone measuring instruments (the first ones).

In March 1968, “Applied Optics” published Dr. Dobson’s full-length article on the work done by his group at Oxford since 1922 to measure atmospheric ozone {2}.

Since then a number of books and papers have been published about atmospheric ozone. But they are scattershot rather than methodical … collections of anecdotes … stories. They present no data that can be readily compared to previous data in any consistent way. Although the new guys pay homage to Dobson by giving his name to the unit of measure, they NEVER refer to Dobson’s 40+ years of work, or to his writings, or to his data.

For example, Dr. Dobson published the following graphic in both his 1963 and 1968 editions:

And in 1968, he published the following:

[0.25 cm = 250 Dobsons = 1/8" thickness of ozone spread thru 30 km of altitude!]

The new guys fuss over 6% “depletion”! A 6% variation of an average cannot be measured with ANY certainty thru 30 km of upper atmosphere!

Dobson’s May to April graphs {2} of the first measurements of Antarctic ozone correlate with the Arctic cycle (adjusted by six months).

[Seasonality in the southern hemisphere is out of phase with ours.] Halley Bay is at 76 degrees S. latitude; Spitzbergen at 80 degrees N. latitude. Dobson also discovered ozone anomalies in Canada and northern India.

Instead of updating the early data, his successors homogenize data {3} and use one-time readings which tell us very little. They use selective data {4}, make retroactive adjustments, and devise theoretical models to create imaginary trends which they then pit against Dobson’s documented observations and experiments (“The Hole in the Ozone Scare”, Maduro & Schauerhammer, 1992). In 1982 Dobson’s instruments were replaced and , voila!, the scary “hole” suddenly appeared.

Gribbin (1998) uses some undefined composite {3}, which shows little fluctuation over the years, in an effort to demonstrate long term stability of the ozone layer until the surprise “discovery” of ozone depletion. By contrast, Dobson data show minor fluctuation at the equator but DRAMATIC seasonal (and daily) variation at both poles {1}, {2} … around 40% even in the 1950’s (in the pre-Freon era) … with a 60% difference between polar and equatorial readings! One could even say that the year-round normal polar ozone level is around 250, but INCREASES to 400+ with spring warming!! NO HOLES!!!

An apocalyptic graph {4}, with a misleading vertical axis, does not help us understand what is really happening, especially in light of the conflict with Dobson’s work.

Other elements ignored by all of the disaster mongers include: Mt. Erebus, the surface caldera volcano 18 miles upwind of McMurdo; 1958 French polar vortex data; long-term solar cycles; 1988 Japanese data; bacterial and ocean floor interactions with CFCs; and gross oversimplifications in the computer models. (Maduro). Scientists are required to answer and satisfy ALL criticisms of their theories. But instead, the current crop is trying to bury and intimidate its critics.
 
Koch et al Tillerson can’t wait soon enought for the arctic to melt so they can begin drilling with Putin Gazprom and half trillion dollar payout to Exxon and Tillerson. Meanwhile,

Why Did an Enormous Chunk of West Antarctica Suddenly Start Melting?

300,000 square miles is nearly twice the area of California. It’s difficult to visualize a space that vast, but go ahead and give it a try. Now, imagine this California plus-sized chunk of land is covered in thousands of feet of ice. Then, all of a sudden, that frozen fortress becomes a wading pool.

In January 2016, over the course of just a few weeks, a 300,000 square mile chunk of the West Antarctic ice sheet started turning to slush, in one of the largest melt-outs ever recorded. Scientists with the ARM West Antarctic Radiation Experiment (AWARE), who reported the epic defrost in Nature Communications last week, believe it was related to the 2015-2016 El Niño. Troublingly, they think massive melts like this could be a harbinger of the future—but more research is needed before we can be sure.
**
The West Antarctic ice sheet has been called the “weak underbelly” of the Antarctic continent, and for good reason: Its glaciers, which contain enough frozen water to raise global sea levels by at least 10 feet, are shedding mass rapidly as the planet heats up.** The prevailing wisdom is that warm ocean waters are weakening West Antarctica’s floating ice shelves from below, and causing inland ice sheets to detach from the underlying land surface at their so-called “grounding line.” But a recent survey found evidence for ephemeral lakes and river networks across Antarctica, raising concerns that surface melting could also play a significant role in ice sheet disintegration.
 
Koch et al Tillerson can’t wait soon enought for the arctic to melt so they can begin drilling with Putin Gazprom and half trillion dollar payout to Exxon and Tillerson. …
I though Trump was also getting a slice of the pie, at least for all that he’s done even if he isn’t invested in oil (which we will never know one way or another). 🙂
 
There are problems with taking historical surface temperatures as the guide …
And there are problems with satellite and balloon temps too (like mixing in of cooler stratospheric temps) and instrument problems. Plus the fact that these temps do not go back as far in time as the surface temps.

And the MAIN POINT being that article did NOT say the satellite temps showed a cooling trend, only that the models showed more of a warming trend than the satellite temps.

So it’s all a big fat red herring.
 
We have arctic temperature data going back to 1958.

Kahl analyzed the data and said that global warming is bogus.

onlinelibrary.wiley.com/doi/10.1029/93JD00818/full

Abstract

Arctic temperature trends in four tropospheric layers during the period 1958–1986 are examined through analysis of a comprehensive archive of Arctic upper air meteorological data. The goals of the study are to describe the trends in Arctic tropospheric temperatures and to provide verification data for model simulations of Arctic and global climate. This analysis extends the work of previous researchers by examining rawinsonde time series from a much denser distribution of stations than was previously available and by resolving the vertical distribution of tropospheric temperatures as well. Absolute trends of 3°C/30yr or larger were found, with both cooling and warming tendencies observed in all layers. The majority of the trends, however, are not statistically significant. Considerable regional and seasonal variability is observed. Trends at many stations in Eurasia and Greenland are highly sensitive to large positive anomalies during the period 1958–1963, which may be artifacts of the data. On the basis of our analysis, we conclude that greenhouse-induced warming is not detectable in the Arctic troposphere for the 1958–1986 period.
 
Status
Not open for further replies.
Back
Top