WSJ: Whatever Happened to Global Warming?

  • Thread starter Thread starter Theo520
  • Start date Start date
Status
Not open for further replies.
Indeed. You are looking at a balance sheet. You are expecting an increase based upon financial reports that are from questionable sources.
Nope. I’m looking at the cash flow in the company’s account (energy flux through the Karman line), and what I’m seeing does not match the books (surface temperature). I’m concluding that the books must be off. You and estesbob are telling me that I should go with the books anyway.

**There’s absolutely no way that the outgoing IR flux can be constant with increasing CO2 – that would mean that Beer-Lambert’s law does not hold. ** The excess energy must be retained somewhere below the Karman line.
 
Nope. I’m looking at the cash flow in the company’s account (energy flux through the Karman line), and what I’m seeing does not match the books (surface temperature). I’m concluding that the books must be off. You and estesbob are telling me that I should go with the books anyway.

**There’s absolutely no way that the outgoing IR flux can be constant with increasing CO2 – that would mean that Beer-Lambert’s law does not hold. ** The excess energy must be retained somewhere below the Karman line.
That is assuming there is excess energy.
 
That is assuming there is excess energy.
Again, Beer-Lambert’s law plus Gauss’ law dictates that there must be.

If you can demonstrate that there is no excess energy, then you have demonstarted violation of Beer-Lambert and/or Gauss on planetary scale – that’s instant Nobel prize.
 
In Lynn’s post it is obvious that the term deeper oceans is used to compare the shallower portions with the deeper ones. Did you really think Lynn was claiming the oceans were getting deeper?
If you think she’s arguing for the deep ocean heatsink as the preferred excuse, you do realize it cuts CO2 sensitivity in half?

Thus I would expect the IPCC to confirm a number below 2.25 in their next update, and then they can start dismantling their office space (no longer required)
 
If you think she’s arguing for the deep ocean heatsink as the preferred excuse, you do realize it cuts CO2 sensitivity in half?
Yes.

I, for one, would be very happy if this was proven, because (1) it would explain the longstanding mismatch between basic physics approach and paleo data (former gives you 2C sensitivity, the latter 4C on average) and (2) it would mean that global warming is manageable without destroying world’s economy.
Thus I would expect the IPCC to confirm a number below 2.25 in their next update, and then they can start dismantling their office space (no longer required)
Higher max CO2 cap does not mean no max CO2 cap.

World economy will still have to be moved off carbon, except that in a slower manner.
 
Again, Beer-Lambert’s law plus Gauss’ law dictates that there must be.

If you can demonstrate that there is no excess energy, then you have demonstarted violation of Beer-Lambert and/or Gauss on planetary scale – that’s instant Nobel prize.
Looks like they were wrong.
 
I am in favor of a proposal by Freeman Dyson: CO2 can be controlled by planting trees. A rough calculation indicates that an area of forest equal to six Ohios (I live in Ohio) would fix the CO2 at its present concentration. If there were a free market way of running such a project, I would be in favor of it. But I cannot see how it would be done except by the government.
I think the government can help with the tree planting in a number of ways. About 1/3 of the continental U.S. is pasture land. Not all of it is suitable for trees, but a lot of it is. The various University extension divisions very much encourage “silvopasture”; that is, pasture that is divided by tree belts. There are two advantages to it. First, the trees can be valuable in themselves eventually. Second, they produce shade for the pasture part of the day if done right. That is an anti-drought measure. In the area in which i live, black walnuts are probably the best silvopasture trees because their shade is filtered and their leaves crumble to nothing in the fall and won’t smother grass. In other places, there are probably better suited trees.

Some people do it, but a lot of people don’t because it takes a long, long time for the trees to even become useful for partial shade and a lifetime to have any real value as timber.

The government provides immense subsidies for almost every agricultural practice except ranching, and certainly not for silvopasture development. It’s a “natural” in a lot of ways, but while the government can and does subsidize tobacco, it won’t subsidize silvopasture. It does provide very meager subsidies for forest development, but they’re a hassle. It would help if the farmer or rancher could deduct the value of his labor.

But it doesn’t have to be silvopasture alone. Grass can also capture and store carbon. The government is coming very tardily to a realization that reducing “old grass” by biodegradation stores carbon in the soil and enriches it in the process. If you don’t ensure that, then it reduces by oxidation. The solution is “mob grazing” and rapid rotation. Old grass, seed stems, etc, won’t biodegrade unless they’re put into firm contact with the soil. Hoofed livestock will do that, but only if they “mob graze” will they do it efficiently. But the problem with those programs is that they’re desultory and bring a high degree of regulation with them. In addition, they’re expensive even with subsidies. Takes a lot of fencing and water sources to do it.

Even being able to write off the costs immediately would help, but tax laws don’t allow it.
 
Ridgerunner, I only suggested trees as a consumer of CO2 because it was easy to find the amount consumed by trees. Any sort of plant would help. I like the notion of planting trees because my conservative friends are bothered by cap-and-trade and similar proposals.
weller2, Inform yourself about the Lambert-Beer law. It is violated under many circumstances. In particular, it assumes monochromatic light, and low concentration; of the order of 0.05M.
 
Ridgerunner, I only suggested trees as a consumer of CO2 because it was easy to find the amount consumed by trees. Any sort of plant would help.
Are you sure? Trees lock up carbon for a long long time, but grasses die each year and quickly decay, releasing the carbon they captured back into the atmosphere a lot sooner than would a tree.
 
The reason scientists and science communicators get “annoyed” is because to deny anthropogenic global warming is to ignore over a century of where the current science has led up to. It also must necessarily deny the same physics that allows us to use satellites to interpret atmospheric conditions on Earth or other planets, or for that matter, how heat-seeking missiles work. It is the result of thousands and thousands of papers that have accumulated beginning with formulations of planetary energy balance, understanding ice ages, the development of quantum theory, the recognition of how ocean buffer chemistry works, the long-term observations of temperature, CO2, sea levle rise (not just a little over a decade of that data), etc. Ignoring all of this research is usually justified by saying it’s an appeal to authority (not true) or that the gut feeling of the arguer is preferable.

I could recommend good historical references to learn all this, but it seems a waste of time: the current generation of “arguments” against global warming can only be described as pseudoskeptical-- they are based on talking points and zombie ideas (arguments that keep coming to life even after being discredited countless times). .
  1. we were in a ‘Little Ice Age’ that ended around 1820 and the planet has been warming since, but that is not necessarily a bad thing, is it? And the current plateu of temperatures suggests that cycle may no be over.
  2. Real science is testable, i.e. it has conditions that if they came about would prove the idea to be FALSE. What is the falsifying criteria for Global Warming? If it gets hotter that proves Global Warming. If it gets colder that is evidence of Climate Change. IF it gets stormier with more hurricanes that is Global Warming, but if it is calmer and no hurricanes, then we have abnormal Climate Change. No matter what actually happens, EVERYTHING proves Climate Change. And no wonder, because the climate has ALWAYS changed.
Thus ‘Climate Change’ is a tautology, untestable and nothing more than quack pseudo-science.
 
Yes.

I, for one, would be very happy if this was proven, because (1) it would explain the longstanding mismatch between basic physics approach and paleo data (former gives you 2C sensitivity, the latter 4C on average) and (2) it would mean that global warming is manageable without destroying world’s economy.

Higher max CO2 cap does not mean no max CO2 cap.

World economy will still have to be moved off carbon, except that in a slower manner.
Do you have any idea of the economic hardship that would create?

All because some scientists needed that government funding just really really badly?
 
  1. we were in a ‘Little Ice Age’ that ended around 1820 and the planet has been warming since…
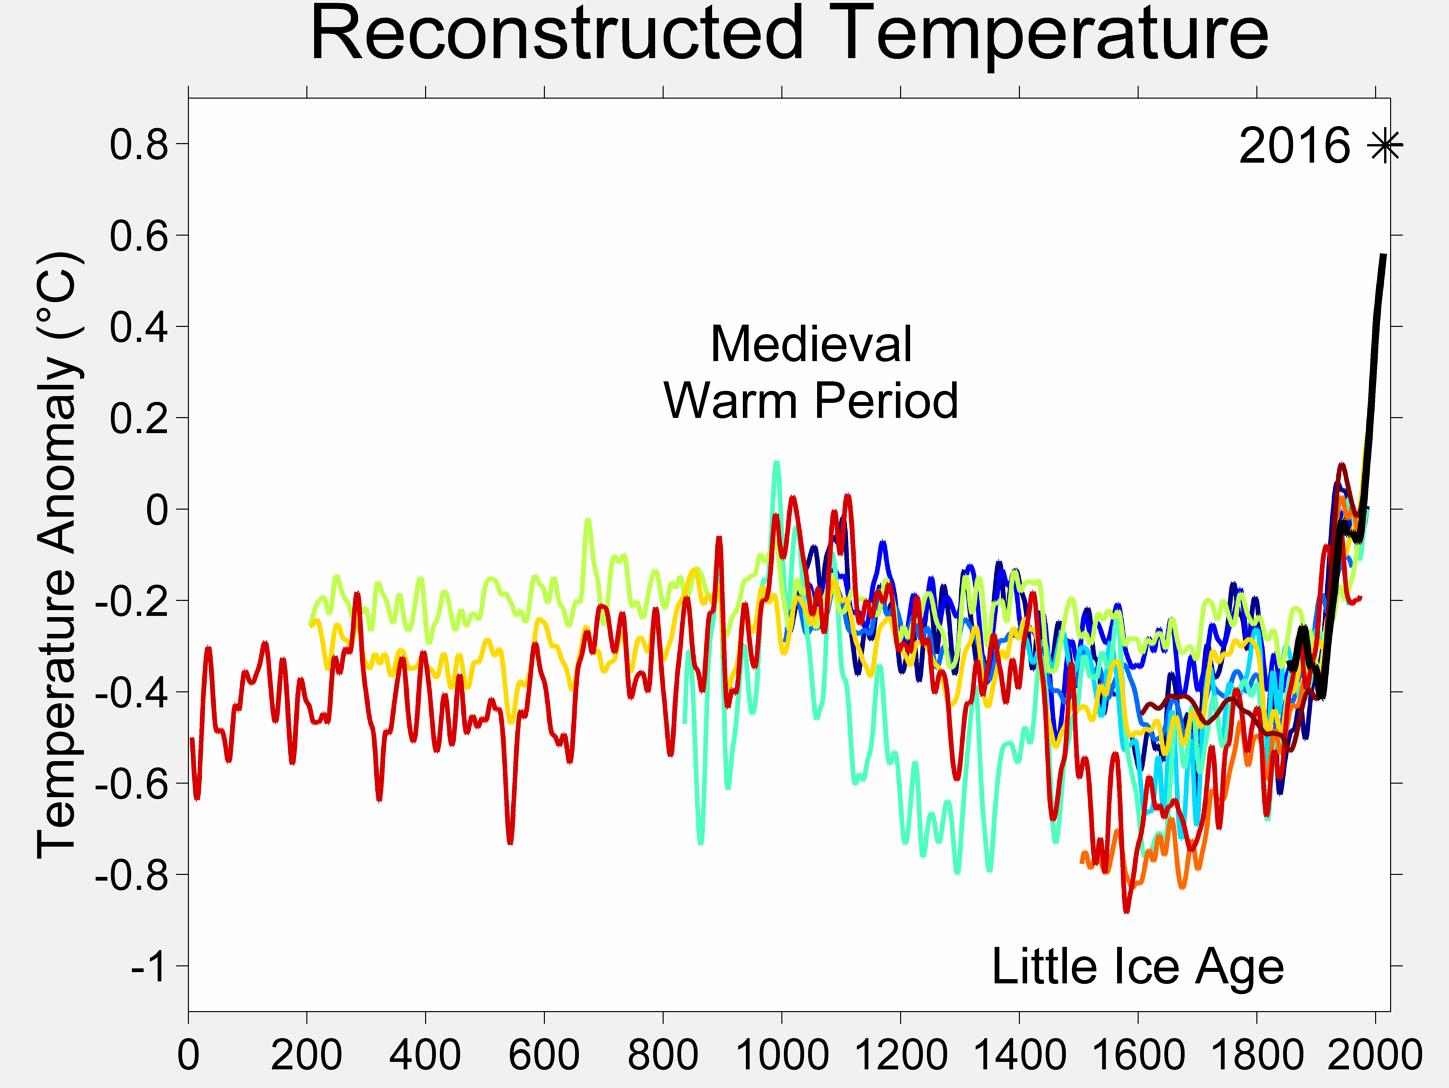
Viewing the warming in the past 50 years as nothing more than the natural recovery from the Little Ice Age is not reasonable if you look at the data quantitatively. Consider this:

It is clear that the rate of temperature change for things like entry into and exit from the Little Ice Age is at most 0.6 deg. C over a 300 year period. However the warming that has occurred so far in the industrial age that is accompanied by huge CO2 increases has been about 0.6 deg. C over 50 year period. That is 6 times faster than anything that natural variation has done in the past 2000 years, any maybe longer. There is clearly something else involved than what you say, and that something else is most likely CO2 from human activity, which the theory of greenhouse gasses predicts.
…but that is not necessarily a bad thing, is it?
That depends on who you are. Obviously a few people will benefit in the short term from global warming. But it will be worse for most people, and devastating for some.
And the current plateu of temperatures suggests that cycle may no be over.
If you call 17 years a plateau. But when viewed on the time scale in the graph above, 17 years would not even be visible as a plateau as you view the entire graph.
  1. Real science is testable, i.e. it has conditions that if they came about would prove the idea to be FALSE. What is the falsifying criteria for Global Warming? If it gets hotter that proves Global Warming. If it gets colder that is evidence of Climate Change. IF it gets stormier with more hurricanes that is Global Warming, but if it is calmer and no hurricanes, then we have abnormal Climate Change. No matter what actually happens, EVERYTHING proves Climate Change.
This is a straw man argument because the real global warming theory has clearly testable hypotheses. But by the nature of the hypotheses, the test involves many decades to perform, which is too bad for those who demand instant gratification.
 
All because some scientists needed that government funding just really really badly?
This is a very unreasonable claim. Even accepting that a scientist might be inclined to falsify results to keep government funding, that still does not explain how these scientists from all over the world working for different governments could succeed in colluding to prevent any one of them from leaking the details of the fraud to the press. There would be too much temptation to break ranks and report on what the fraudulent scientists were doing. Also that does not explain why funding to support global warming is so much easier to come by than funding to refute global warming. There is much more money available from big oil to do that.
 
Viewing the warming in the past 50 years as nothing more than the natural recovery from the Little Ice Age is not reasonable if you look at the data quantitatively. …
It is clear that the rate of temperature change for things like entry into and exit from the Little Ice Age is at most 0.6 deg. C over a 300 year period. …
The proverbial hockey stick graph is fictional. The authors used proxy data when it suited them (prior to 1950 IIRC) then went with their ‘adjusted’ data for the post 1950 temps when continued use of the proxy data would show a continued decline in temperatures.

A few items I have collected off the major news sources that are following the AGW ‘adjusted data’ scandal.

Temperature record with CO2 levels for the last 600 million years
c3headlines.typepad.com/.a/6a010536b58035970c017c37fa9895970b-pi

Last 10,000 years
jonova.s3.amazonaws.com/graphs/lappi/gisp-last-10000-new.png

Why Hansen Had To Corrupt The Temperature Record | Real Science

stevengoddard.files.wordpress.com/2012/05/1998changesannotated-1.gif?w=640

stevengoddard.files.wordpress.com/2012/05/iceland-1.gif?alt&w=640

climateaudit.org/2010/12/26/nasa-giss-adjusting-the-adjustments/
As a simple exercise, I quickly revisited the everchanging Hansen adjustments, a topic commented on acidly by E.M. Smith (Chiefio) in many posts – also see his interesting comments in the thread at a guest post at Anthony‘s, a post which revisited the race between 1934 and 1998 – an issue first raised at Climate Audit in 2007 in connection with Hansen’s Y2K error.
As CA readers recall, Hansen’s Y2K error resulted in a reduction of US temperatures after 2000 relative to earlier values. The change from previous values is shown in red in the graphic below; the figure also shows (black) remarkable re-writing of past history since August 2007 – a rewriting of history that has increased the 2000-6 relative to the 1930s by about 0.3 deg C.
climateaudit.files.wordpress.com/2010/12/nasa_us_adjustments.png?w=480&h=480

Climategate: The Smoking Code | Watts Up With That?
Now, here is some actual proof that the CRU was deliberately tampering with their data. Unfortunately, for readability’s sake, this code was written in Interactive Data Language (IDL) and is a pain to go through.
NOTE: This is an actual snippet of code from the CRU contained in the source file: briffa_Sep98_d.pro
1;
2; Apply a VERY ARTIFICAL correction for decline!!
3;
4 yrloc=[1400,findgen(19)*5.+1904]
5 valadj=[0.,0.,0.,0.,0.,-0.1,-0.25,-0.3,0.,-0.1,0.3,0.8,1.2,1.7,2.5,2.6,2.6,2.6,2.6,2.6]*0.75 ; fudge factor
6 if n_elements(yrloc) ne n_elements(valadj) then message,‘Oooops!’
7
8 yearlyadj=interpol(valadj,yrloc,timey)
So the fudge factor is adjusting each year by their calendar year starting with 1904, in five year increments. Note that starting in 1930 the function arbitrarily subtracts 0.1 degrees, then in 1936 it removes 0.25, etc. Then in 1955 it begins to ADD temperature adjustments beginning with 0.3, etc.

Is it any wonder we have ‘global warming’?

Just the name ‘fudge factor’ at line 5 should be a dead give away.

wattsupwiththat.com/2013/01/18/hansens-nasa-giss-cooling-the-past-warming-the-present/
I ran a post yesterday, showing how the latest version of GISSTEMP had changed from using Hadley/Reynolds to ERSST for ocean temperatures, with the result that about 0.03C had been added to recent warming.
However, this is not the only change they have made to the historical temperature record in recent years. Climate4You, fortunately, archived the GISS data in May 2008. Comparing this dataset with today’s version, we can see that about 0.10C of warming, or more, has been added to temperatures in the last decade, compared to data up to about 1950.
notalotofpeopleknowthat.files.wordpress.com/2013/01/image32.png
 
Very revealing programmer comments found in the hacked emails in the Climategate scandal, and they explain how we have ‘Global Warming’ no matter what the temperatures may actually be.

And note how they call the temperatures they want to see the ‘real’ temperatures, when ordinary people might think the MEASURED proxy temperatures would be the ‘real’ temperatures or else the proxy temps are worthless anyway!

Climategate: hide the decline ? codified | Watts Up With That?

WUWT blogging ally Ecotretas writes in to say that he has made a compendium of programming code segments that show comments by the programmer that suggest places where data may be corrected, modified, adjusted, or busted. Some the HARRY_READ_ME comments are quite revealing. For those that don’t understand computer programming, don’t fret, the comments by the programmer tell the story quite well even if the code itself makes no sense to you…

?FOIA\documents\osborn-tree6\mann\oldprog\maps12.proFOIA\documents\osborn-tree6\mann\oldprog\maps15.proFOIA\documents\osborn-tree6\mann\oldprog\maps24.pro; Plots 24 yearly maps of calibrated (PCR-infilled or not) MXD reconstructions
; of growing season temperatures. Uses “corrected” MXD - but shouldn’t usually
; plot ***past 1960 because these will be artificially adjusted ***to look closer to
; the real temperatures.


; anomalies against full NH temperatures and other series.
; CALIBRATES IT AGAINST THE LAND-ONLY TEMPERATURES NORTH OF 20 N
;
; Specify period over which to compute the regressions*** (stop in 1960 to avoid
; the decline***


; Specify period over which to compute the regressions (stop in 1960 to avoid
; the decline that affects tree-ring density records)


;getting seriously fed up with the state of the Australian data. so many new stations have been
; introduced, so many false references… so many changes that aren’t documented.


;I am very sorry to report that the rest of the databases seem to be in nearly as poor a state as
; Australia was. There are hundreds if not thousands of pairs of dummy stations


Here, the*** expected 1990-2003 period is MISSING ***- so the correlations aren’t so hot! Yet
the WMO codes and station names /locations are identical (or close). **What the hell is
supposed to happen here? Oh yeah - there is no ‘supposed’, I can make it up. So I have 🙂


It’s Sunday evening, I’ve worked all weekend, and just when I thought it was done I’m
hitting yet another problem that’s based on the hopeless state of our databases. There is no uniform
data integrity
, it’s just a catalogue of issues that continues to grow as they’re found.


printf,1,’(April-September) temperature anomalies (from the 1961-1990 mean).’
printf,1,’Reconstruction is based on tree-ring density records.’
printf,1
printf,1,’NOTE: recent decline in tree-ring density has been ARTIFICIALLY’
printf,1,’REMOVED to facilitate calibration. THEREFORE, post-1960 values’
printf,1,’will be much closer to observed temperatures then they should be
,’
printf,1,’which will incorrectly imply the reconstruction is more skilful’
printf,1,’than it actually is.


printf,1,‘temperature in many high-latitude locations. In this data set’
printf,1,’this “decline” has been artificially removed in an ad-hoc way, and’
printf,1,'this means that data after 1960 no longer represent tree-ring
printf,1,'density variations, but have been modified to look more like the
printf,1,'observed temperatures
.’


; Apply a VERY ARTIFICAL correction for decline!!
;
yrloc=[1400,findgen(19)*5.+1904]
valadj=[0.,0.,0.,0.,0.,-0.1,-0.25,-0.3,0.,-0.1,0.3,0.8,1.2,1.7,2.5,2.6,2.6,$
2.6,2.6,2.6]*0.75 ; fudge factor
(…)
;
; APPLY ARTIFICIAL CORRECTION
;
yearlyadj=interpol(valadj,yrloc,x)
densall=densall+yearlyadj


; MUST ALTER FUNCT_DECLINE.PRO TO MATCH THE COORDINATES OF THE
; START OF THE DECLINE *** ALTER THIS EVERY TIME YOU CHANGE ANYTHING ******


applied the calibration to unfiltered MXD data (which
; gives a zero mean over 1881-1960) after extending the calibration to boxes
; without temperature data (pl_calibmxd1.pro). We have identified and
; artificially removed (i.e. corrected) the decline in this calibrated
; data set. We now recalibrate this corrected calibrated dataset against
; the unfiltered 1911-1990 temperature data
, and apply the same calibration
; to the corrected and uncorrected calibrated MXD data.

 
The proverbial hockey stick graph is fictional. The authors used proxy data when it suited them (prior to 1950 IIRC) then went with their ‘adjusted’ data for the post 1950 temps when continued use of the proxy data would show a continued decline in temperatures.
Since you distrust the data in my posting, suppose we use the data that led you to conclude we came out of the little ice age in 1820. What would you say was the fastest 50-year average temperature rise or fall going into or coming out of the Little Ice Age?

Then compare that with the non-proxy data from 1950 onward. What does your calculation of temperature rise say? (Please cite your data souce so I can check your work.)
 
“If you don’t like the weather in New England now, just wait a few minutes.”

Mark Twain

New version " If you don’t like the weather in New England now we must impose vast new regulations and higher taxes"
 
Status
Not open for further replies.
Back
Top