Catholic Climate Movement

  • Thread starter Thread starter Beautiful
  • Start date Start date
Status
Not open for further replies.
It is also a matter of public record what climate scientists have said about global warming.

Actually, it does. There are surface readings and satellite readings. Which one is more reliable? How are satellite readings actually calibrated? How do we know they measure what they are supposed to measure. And for surface readings, how do we take into account changing conditions around the monitoring sites? How do we know that the distribution of monitoring sites is correct for the global average we want to measure? Not so simply after all, is it?
Are you trying to provide answers or hide them?

It always seems that when called into question, some people always obfuscate instead of explain.

Usually this is a good indication of the validity of the claim.
 
I think the reason you fell so confident opining about climate change is that you don’t think it is as real science and does not involve technical expertise. I would not venture to put my opinion up against experts in any of those fields.
Now that you have established that everyone without your approved set of credentials cannot form an opinion…
 
Now that you have established that everyone without your approved set of credentials cannot form an opinion…
Oh, anyone can form an opinion on scientific questions. But their opinion is not as likely to be correct as the opinion of an expert in the specific field.
 
Would you be as comfortable and confident deciding between two controversial views of techniques of neuro-surgury by reading the arguments presented by their practitioners? Or how about deciding between two camps of experts in materials for casings in oil drilling? Can you evaluate the arguments of nuclear scientists about the relative safety of two methods of storing spent fuel? I think the reason you fell so confident opining about climate change is that you don’t think it is as real science and does not involve technical expertise. I would not venture to put my opinion up against experts in any of those fields.
You keep trying to make this into a technical choice while I keep telling you that that is not the issue. Take the Oreskes-Piser dispute. There is no highly technical data involved. Searches were run, summaries were categorized, conclusions were drawn. It takes no special expertise to read their reports, and the comments of others, and come to a decision as to whether the conclusions were justified.

An even better example is Mann’s Hockey Stick graph. Does anyone really have to be an expert on temperature reconstruction from tree rings to doubt the validity of his chart? No. Pretty much everyone recognizes it is bogus. You cannot seriously believe that just because we are unable to individually collect such data - or understand the calculations involved - that we are therefore incapable of coming to an informed position on his work.
But I can count. And the number of scientists who say global warming is real outnumber those who do not.
This is silly. You’re saying that your opinion, based on nothing more than anecdotal experience, is justifiable while the opinions of others, based on the evidence collected by those who have tried to categorize what scientists have actually said, is unjustified. I guess if you know you’re right, facts are irrelevant.

Ender
 
I am finding this fascinating.

People love to trot out graphs and charts of varying complexity to support their views.

But when someone says they looked at the data itself, what is the reaction…?
“NOOOO!!!”
 
You keep trying to make this into a technical choice while I keep telling you that that is not the issue. Take the Oreskes-Piser dispute.
If you look back at the arguments I have been responding to, they** were** about technical choices. For example:

The claim that anyone can download the historical temperature record and decide for themselves if there is a trend for warming.

The claim that consensus does not matter when discussing scientific issues because we should all just look at the raw data.

I never claimed that it takes special technical expertise to count up publications. That I will agree is non-technical enough that any moderately intelligent person should be able to do it.
An even better example is Mann’s Hockey Stick graph. Does anyone really have to be an expert on temperature reconstruction from tree rings to doubt the validity of his chart? No.
As this is a technical result in a field that people dedicate their lives to learning, I think one does need some technical expertise in temperature reconstruction to assess the validity of the Mann chart, except for minor points of style.
Pretty much everyone recognizes it is bogus.
Well, then, someone should correct the Wikipedia article on this which states:
More than two dozen reconstructions, using various statistical methods and combinations of proxy records, have supported the broad consensus shown in the original 1998 hockey-stick graph, with variations in how flat the pre-20th century “shaft” appears.[12][13] The 2007 IPCC Fourth Assessment Report cited 14 reconstructions, 10 of which covered 1,000 years or longer, to support its strengthened conclusion that it was likely that Northern Hemisphere temperatures during the 20th century were the highest in at least the past 1,300 years.[14] Over a dozen subsequent reconstructions, including Mann et al. 2008 and PAGES 2k Consortium 2013, have supported these general conclusions.
You cannot seriously believe that just because we are unable to individually collect such data - or understand the calculations involved - that we are therefore incapable of coming to an informed position on his work.
I do.
 
If you look back at the arguments I have been responding to, they** were** about technical choices. For example:

The claim that anyone can download the historical temperature record and decide for themselves if there is a trend for warming.
First, anyone can download the data; it’s out on the NASA/NOAA website. Second, anyone can access the temperature charts that have been compiled by others using the available data, so there is really no reason to have to chart them again. The issue has never been about dealing with the raw data; it is about dealing with the conclusions being drawn.
The claim that consensus does not matter when discussing scientific issues because we should all just look at the raw data.
I don’t recall anyone making such a claim. I’ll use Mann’s graph again. Virtually no on believes his chart was accurate, but that position was not arrived at by the population analyzing his data. A couple of statisticians analyzed the data and their report was published. The result was that Mann’s graph disappeared from the next IPCC report, and it is generally held to be nonsense. Have you no opinion about his assertions? If you don’t, you’ve abandoned any claim to understand the issue, and if you do you’ve falsified your claim that the layman cannot make an informed decision about a scientific issue.
As this is a technical result in a field that people dedicate their lives to learning, I think one does need some technical expertise in temperature reconstruction to assess the validity of the Mann chart, except for minor points of style.
No such expertise is necessary. First, a cursory glance at his chart which shows neither the MWP or the LIA, ought to raise flags. Second, his chart was devastated not by other experts in the field but by two statisticians. Third, if you actually believed in the validity of “consensus” you would have already abandoned Mann, given that pretty much everyone else has.

Ender
 
I don’t recall anyone making such a claim. I’ll use Mann’s graph again. Virtually no on believes his chart was accurate…
Again, I will remind you that the Wikipedia article on Mann’s chart says:

*More than two dozen reconstructions, using various statistical methods and combinations of proxy records, have supported the broad consensus shown in the original 1998 hockey-stick graph, with variations in how flat the pre-20th century “shaft” appears.[12][13] The 2007 IPCC Fourth Assessment Report cited 14 reconstructions, 10 of which covered 1,000 years or longer, to support its strengthened conclusion that it was likely that Northern Hemisphere temperatures during the 20th century were the highest in at least the past 1,300 years.[14] Over a dozen subsequent reconstructions, including Mann et al. 2008 and PAGES 2k Consortium 2013, have supported these general conclusions. *

So if everyone knows his chart was in error, why don’t some of them correct the Wikipedia article? I don’t think the criticism of Mann is such a slam dunk as you pretend.
Third, if you actually believed in the validity of “consensus” you would have already abandoned Mann, given that pretty much everyone else has.
As I showed, it is harder to establish that claim than you think.
 
Again, I will remind you that the Wikipedia article on Mann’s chart says:

*More than two dozen reconstructions, using various statistical methods and combinations of proxy records, have supported the broad consensus shown in the original 1998 hockey-stick graph, with variations in how flat the pre-20th century “shaft” appears.[12][13] The 2007 IPCC Fourth Assessment Report cited 14 reconstructions, 10 of which covered 1,000 years or longer, to support its strengthened conclusion that it was likely that Northern Hemisphere temperatures during the 20th century were the highest in at least the past 1,300 years.[14] Over a dozen subsequent reconstructions, including Mann et al. 2008 and PAGES 2k Consortium 2013, have supported these general conclusions. *

So if everyone knows his chart was in error, why don’t some of them correct the Wikipedia article? I don’t think the criticism of Mann is such a slam dunk as you pretend.

As I showed, it is harder to establish that claim than you think.
Mann himself has said his work is not that important, that GW was already well established before he did his work.

Apparently the mistake he made was not mentioning in the cover image that the chart was a splicing of the proxy data with the more recent instrumental data – tho he did cite that in the body of his work.

Also, another interesting tidbit is that the instrumental data since the 1960s actually showed greater warming than the more recent proxy tree-ring data, that the proxy failed after the 1960s to reflect temperature.

I’m thinking that is because while warming in general helps the trees, giving them bigger rings, the type of warming due to the GH effect, in which the nights are warming faster than the days, is actually harmful to plants (and people).

I wrote to Mann about it; he didn’t know, so he suggested other contacts, but they didn’t know either.

However, there are studies that do show the night (minimum diurnal) warming is harmful to rice paddy, while the day (maximum diurnal) warming has so far been helpful – the two cancelling each other out – but it is expected both the day and night warming will be harmful in a few decades as GW continues to increase.

See: Welch, J., J. R. Vincent, M. Auffhammer, P. F. Moya, A. Dobermann, and D. Dawe. 2010. “Rice Yields in Tropical/Subtropical Asia Exhibit Large but Opposing Sensitivities to Minimum and Maximum Temperatures.” Proceedings of the National Academy of Sciences 107(33):14562-14567.

Also health experts, speaking of the 2003 Europe heat wave that killed some 35,000 people, said it was more from the hot nights than the hot days, saying that the body needs a cooling period to recuperate after being heat stressed during the day.

One of the findings re GW is that the nights are warming faster than the days. I call it “the blanket effect.” See bjerknes.uib.no/en/article/news/understanding-why-nights-are-getting-warmer-faster-days-0
 
Mann himself has said his work is not that important, that GW was already well established before he did his work.

Apparently the mistake he made was not mentioning in the cover image that the chart was a splicing of the proxy data with the more recent instrumental data – tho he did cite that in the body of his work.

Also, another interesting tidbit is that the instrumental data since the 1960s actually showed greater warming than the more recent proxy tree-ring data, that the proxy failed after the 1960s to reflect temperature.

I’m thinking that is because while warming in general helps the trees, giving them bigger rings, the type of warming due to the GH effect, in which the nights are warming faster than the days, is actually harmful to plants (and people).

]
I would think a person would have to know a lot more about trees, particularly the trees used for the proxy information, than people studying tree rings likely do.

A lot of things make for bigger or smaller tree rings, and one would have to know a lot of history, and very intimately, to know the causes of differences. An unusually wet year, for example, can cause narrow rings just as an extraordinarily dry one can, because, in some places at least, high moisture in the summer can greatly influence the population of leaf pests, reducing photosynthesis. But it’s not always true because those pests tend to have population cycles, possibly influenced by their own diseases and predators, sort of like the rabbit/coyote cycle.

But, given similar soils, the biggest influences on tree growth are the age of the tree, depending on the kind of tree it is, and root space. A fire, for example, can first retard tree growth, then enhance it. Contrary to popular belief, regular fires usually don’t burn the trees, but they can be stressful initially. Clearing understory by fire, though, will enhance growth of established trees if they’re not too old. If fire is an annual event (which Indians used to ensure) then the effect would depend on other conditions, such as floor burden and moisture content, even the time of year the fire occurred. And fire, of course, greatly influences pest levels for a time.

Animal populations can inhibit or encourage growth, depending on the nature of the animals and their patterns of behavior. In a hot, sunny summer, for example, hoofed animals will spend a lot more time under trees than in a cooler, cloudier summer, and they do it in patterns that are not always obvious to us. Sometimes they will congregate in what seems like an inferior place, but there might be a subtle prevailing updraft that brings lower, cooler, air or just air movement itself. The differences can be big enough to affect animal weight gain dramatically. Animal congregation under trees tends to inhibit growth initially because of compaction. But later on, it can encourage growth due to eventual infiltration of animal waste down to the roots after a spring of ground heaving. And one large dead animal left to rot under a tree can influence growth a lot.

I have long been intrigued by one of the explanations of the excellence of the Stradivarius. One theory is that the Little Ice Age caused the tree or trees from which it was made to grow very slowly, resulting in tighter, harder rings than usual due to cold. And it might be true, though I understand that theory is contested. But it could simply be that herders didn’t take their animals into those areas as much due to the cold or season lengths.

Oddly, and kind of subtly, the height of branches can affect growth. If one pays attention, one can see that trees with wide, low, fairly dense branches affect ground temperature more than trees whose branches begin much higher. A subtle thing, but the ground constantly emanates heat and even tree branches in the winter can “encapsulate” it to a degree, depending on how they’re positioned. The same is true of moisture.

There are so many conditions and events that can affect tree growth, even over a wide area, that I really am skeptical of peoples’ analyses of the meaning of tree rings. Maybe they know all the details they need to know from the history and controlled for them all, but I’m somewhat doubtful that they do or even can.

 
I would think a person would have to know a lot more about trees, particularly the trees used for the proxy information, than people studying tree rings likely do.

A lot of things make for bigger or smaller tree rings, and one would have to know a lot of history, and very intimately, to know the causes of differences. An unusually wet year, for example, can cause narrow rings just as an extraordinarily dry one can, because, in some places at least, high moisture in the summer can greatly influence the population of leaf pests, reducing photosynthesis. But it’s not always true because those pests tend to have population cycles, possibly influenced by their own diseases and predators, sort of like the rabbit/coyote cycle.
I would think those who do temperature reconstruction from tree rings have indeed considered the various factors that might affect tree ring sizes. They did not just formulate an hypothesis and run with it. They tested the hypothesis statistically against contemporary tree rings and associated temperature to develop the correlation. When averaged over a sufficiently long period of time, noise in a correlation can be filtered out. So while no one can say for certain that tree rings from the year 1492 proves a specific temperature, in one averages over 100 years from 1400 to 1500, one can say with increasing certainty what the average temperature was during this period. In addition to averaging temporally, they also average spatially, taking samples from a wide geographic area. This also minimizes the local effects, such as the ones you mentioned.
 
I would think those who do temperature reconstruction from tree rings have indeed considered the various factors that might affect tree ring sizes. They did not just formulate an hypothesis and run with it. They tested the hypothesis statistically against contemporary tree rings and associated temperature to develop the correlation. When averaged over a sufficiently long period of time, noise in a correlation can be filtered out. So while no one can say for certain that tree rings from the year 1492 proves a specific temperature, in one averages over 100 years from 1400 to 1500, one can say with increasing certainty what the average temperature was during this period. In addition to averaging temporally, they also average spatially, taking samples from a wide geographic area. This also minimizes the local effects, such as the ones you mentioned.
One would expect those who study tree rings to at least attempt to control for the immense variations in influences to which trees are subject. But if Mann himself is uncertain about it, why shouldn’t I be?

For a time, there was uncertainty about the whole theory because of a “divergence” in growth rates beginning in about 1960 that seemed to indicate the world was actually cooling, not warming. Mann blew it off, saying it didn’t mean anything during that period though he continued to maintain that at other times it did.

But then, someone came up with the explanation that sunlight would have been dimming since 1960 due to developing countries emissions, and since trees are dependent on photosynthesis for growth, the failure of tree rings since 1960 to indicate growth typically associated with global warming was explained.

Maybe the “dimming sunlight” theory is right, and maybe it isn’t. The data, it seems, that failed to show GW since 1960, was gathered in the arctic, or at least the most disappointing data was.

But among those who study tree rings, how many really know a lot about trees and the many things that can affect their growth, sometimes in small areas and sometimes in large areas? I realize that for believers in MMGW, there is always the belief that every potential source of error or overassumption is accounted for. But I have yet to see anything that convinces me that when it comes to tree ring analysis, these researchers have taken every possible influence into account, or even can.

Tree ring differences are more affected by moisture than by temperature except at the extremes. And sometimes moisture distribution during a growing season means a lot more than moisture during the season itself. Do they really know enough to account for that? How far back do records on the El Nino/La Nina cycle go? What do they know about the effects of disease on populations of Indians who did quite a bit to affect tree types and distribution in North America?

I’m not saying there is nothing worthwhile in the study of tree rings. I’m just saying one would have to know a tremendous amount of information to be able to really control for all conditions and events, and I have not yet seen persuasive evidence that they were able to do it. Apparently neither did Mann, at least before the “dimming sunlight” theory (which might be true) came along.
 
Again, I will remind you that the Wikipedia article on Mann’s chart says:
Let’s see, is this the same Wikipedia that didn’t catch on for years that one person had made himself the doorkeeper for virtually every article dealing with global warming? Given that he had edited over 5,000 articles that was a bit of an oversight. Yes, that particular abuse was corrected, but using Wikipedia as a source is always problematic, especially on this topic.
More than two dozen reconstructions, using various statistical methods and combinations of proxy records, have supported the broad consensus shown in the original 1998 hockey-stick graph, with variations in how flat the pre-20th century “shaft” appears.[12][13] The 2007 IPCC Fourth Assessment Report cited 14 reconstructions, 10 of which covered 1,000 years or longer, to support its strengthened conclusion that it was likely that Northern Hemisphere temperatures during the 20th century were the highest in at least the past 1,300 years.[14] Over a dozen subsequent reconstructions, including Mann et al. 2008 and PAGES 2k Consortium 2013, have supported these general conclusions.
But, since I have championed answering statements rather than ignoring them simply because the source is suspect, let me respond. One of the obvious omissions of this comment is the fact that the chart is missing from the Fifth Assessment Report, so apparently even the IPCC new enough to back off from it. Here is the historical temperature progression from the first assessment report 23 years ago:
1st AR (MWP & LIA)
(Please Note: This uploaded content is no longer available.)
2cd AR: (chop the MWP)
(Please Note: This uploaded content is no longer available.)
3rd AR (Hockey Stick)
(Please Note: This uploaded content is no longer available.)
4th AR (at least the MWP & LIA are hinted at)
(Please Note: This uploaded content is no longer available.)
5th AR (aaand they’re back - MWP & LIA…but not the Hockey Stick)
(Please Note: This uploaded content is no longer available.)
So if everyone knows his chart was in error, why don’t some of them correct the Wikipedia article?
Ah, the absence of evidence is evidence fallacy.
As I showed, it is harder to establish that claim than you think.
No, it isn’t. The truth is there if you’re willing to admit it. See the next post.

Ender
 
Again, I will remind you that the Wikipedia article on Mann’s chart says:
Let’s see, is this the same Wikipedia that didn’t catch on for years that one person had made himself the doorkeeper for virtually every article dealing with global warming? Given that he had edited over 5,000 articles that was a bit of an oversight. Yes, that particular abuse was corrected, but using Wikipedia as a source is always problematic, especially on this topic.
More than two dozen reconstructions, using various statistical methods and combinations of proxy records, have supported the broad consensus shown in the original 1998 hockey-stick graph, with variations in how flat the pre-20th century “shaft” appears.[12][13] The 2007 IPCC Fourth Assessment Report cited 14 reconstructions, 10 of which covered 1,000 years or longer, to support its strengthened conclusion that it was likely that Northern Hemisphere temperatures during the 20th century were the highest in at least the past 1,300 years.[14] Over a dozen subsequent reconstructions, including Mann et al. 2008 and PAGES 2k Consortium 2013, have supported these general conclusions.
But, since I have championed answering statements rather than ignoring them simply because the source is suspect, let me respond. One of the obvious omissions of this comment is the fact that the chart is missing from the Fifth Assessment Report, so apparently even the IPCC new enough to back off from it. If you look at the progression of the historical temperatures from the five Assessment Reports from the IPCC you will see the existence of the MWP and LIA in the 1st, their complete disappearance in the 3rd (when the Hockey Stick appeared), and their reemergence in the 5th. If the IPCC abandoned it after featuring it so prominently before how much credibility can it have?
So if everyone knows his chart was in error, why don’t some of them correct the Wikipedia article?
Ah, the absence of evidence is evidence fallacy.
As I showed, it is harder to establish that claim than you think.
No, it isn’t. The truth is there if you’re willing to admit it. See the next post.

Ender
 
Regarding the validity of Mann’s Hockey Stick graph, here is what has been known about it for over a dozen years.*Canadian scientists Stephen McIntyre and Ross McKitrick have uncovered a fundamental mathematical flaw in the computer program that was used to produce the hockey stick. In his original publications of the stick, Mann purported to use a standard method known as principal component analysis, or PCA, to find the dominant features in a set of more than 70 different climate records.

**But it wasnt so. McIntyre and McKitrick obtained part of the program that Mann used, and they found serious problems. Not only does the program not do conventional PCA, but it handles data normalization in a way that can only be described as mistaken.
*
*Now comes the real shocker. This improper normalization procedure tends to emphasize any data that do have the hockey stick shape, and to suppress all data that do not. To demonstrate this effect, McIntyre and McKitrick created some meaningless test data that had, on average, no trends. This method of generating random data is called Monte Carlo analysis, after the famous casino, and it is widely used in statistical analysis to test procedures. When McIntyre and McKitrick fed these random data into the Mann procedure, out popped a hockey stick shape!
*
(MIT Technology Review, October 15, 2004)
Mann’s Hockey Stick is scientific nonsense, and the fact that you think there is a consensus that supports it says all that needs saying about putting your faith in what you think others believe, and this review supports my contention about the dangers of believing what you read in Wikipedia regarding global warming. It also points out the fact that one doesn’t have to know anything about tree ring proxy temperature reconstruction to destroy a study based on…tree ring proxy temperature reconstructions.

Ender
 
It all swings on what people mean by “supported these general conclusions”

Even the ‘Denier’ Heritage Foundation agrees with the below:
  • CO2 is a GHG
  • CO2 levels are rising
  • Man is contributing to the rise in CO2
  • ergo, man is contributing to global warming
The actual issues are much more nuanced, something the media ignores to push the CAGW agenda.
 
It all swings on what people mean by “supported these general conclusions”

Even the ‘Denier’ Heritage Foundation agrees with the below:
  • CO2 is a GHG
  • CO2 levels are rising
  • Man is contributing to the rise in CO2
  • ergo, man is contributing to global warming
The actual issues are much more nuanced, something the media ignores to push the CAGW agenda.
The usual formulation includes “CO2 levels are rising due to combustion of fossil fuels”

But that’s not the only human contribution to atmospheric carbon. There are other ones, big ones. But nobody in the MMGW community ever pays any attention to them.
 
I would think a person would have to know a lot more about trees, particularly the trees used for the proxy information, than people studying tree rings likely do.

A lot of things make for bigger or smaller tree rings, and one would have to know a lot of history, and very intimately, to know the causes of differences. An unusually wet year, for example, can cause narrow rings just as an extraordinarily dry one can, because, in some places at least, high moisture in the summer can greatly influence the population of leaf pests, reducing photosynthesis. But it’s not always true because those pests tend to have population cycles, possibly influenced by their own diseases and predators, sort of like the rabbit/coyote cycle.

But, given similar soils, the biggest influences on tree growth are the age of the tree, depending on the kind of tree it is, and root space. A fire, for example, can first retard tree growth, then enhance it. Contrary to popular belief, regular fires usually don’t burn the trees, but they can be stressful initially. Clearing understory by fire, though, will enhance growth of established trees if they’re not too old. If fire is an annual event (which Indians used to ensure) then the effect would depend on other conditions, such as floor burden and moisture content, even the time of year the fire occurred. And fire, of course, greatly influences pest levels for a time.

Animal populations can inhibit or encourage growth, depending on the nature of the animals and their patterns of behavior. In a hot, sunny summer, for example, hoofed animals will spend a lot more time under trees than in a cooler, cloudier summer, and they do it in patterns that are not always obvious to us. Sometimes they will congregate in what seems like an inferior place, but there might be a subtle prevailing updraft that brings lower, cooler, air or just air movement itself. The differences can be big enough to affect animal weight gain dramatically. Animal congregation under trees tends to inhibit growth initially because of compaction. But later on, it can encourage growth due to eventual infiltration of animal waste down to the roots after a spring of ground heaving. And one large dead animal left to rot under a tree can influence growth a lot.

I have long been intrigued by one of the explanations of the excellence of the Stradivarius. One theory is that the Little Ice Age caused the tree or trees from which it was made to grow very slowly, resulting in tighter, harder rings than usual due to cold. And it might be true, though I understand that theory is contested. But it could simply be that herders didn’t take their animals into those areas as much due to the cold or season lengths.

Oddly, and kind of subtly, the height of branches can affect growth. If one pays attention, one can see that trees with wide, low, fairly dense branches affect ground temperature more than trees whose branches begin much higher. A subtle thing, but the ground constantly emanates heat and even tree branches in the winter can “encapsulate” it to a degree, depending on how they’re positioned. The same is true of moisture.

There are so many conditions and events that can affect tree growth, even over a wide area, that I really am skeptical of peoples’ analyses of the meaning of tree rings. Maybe they know all the details they need to know from the history and controlled for them all, but I’m somewhat doubtful that they do or even can.
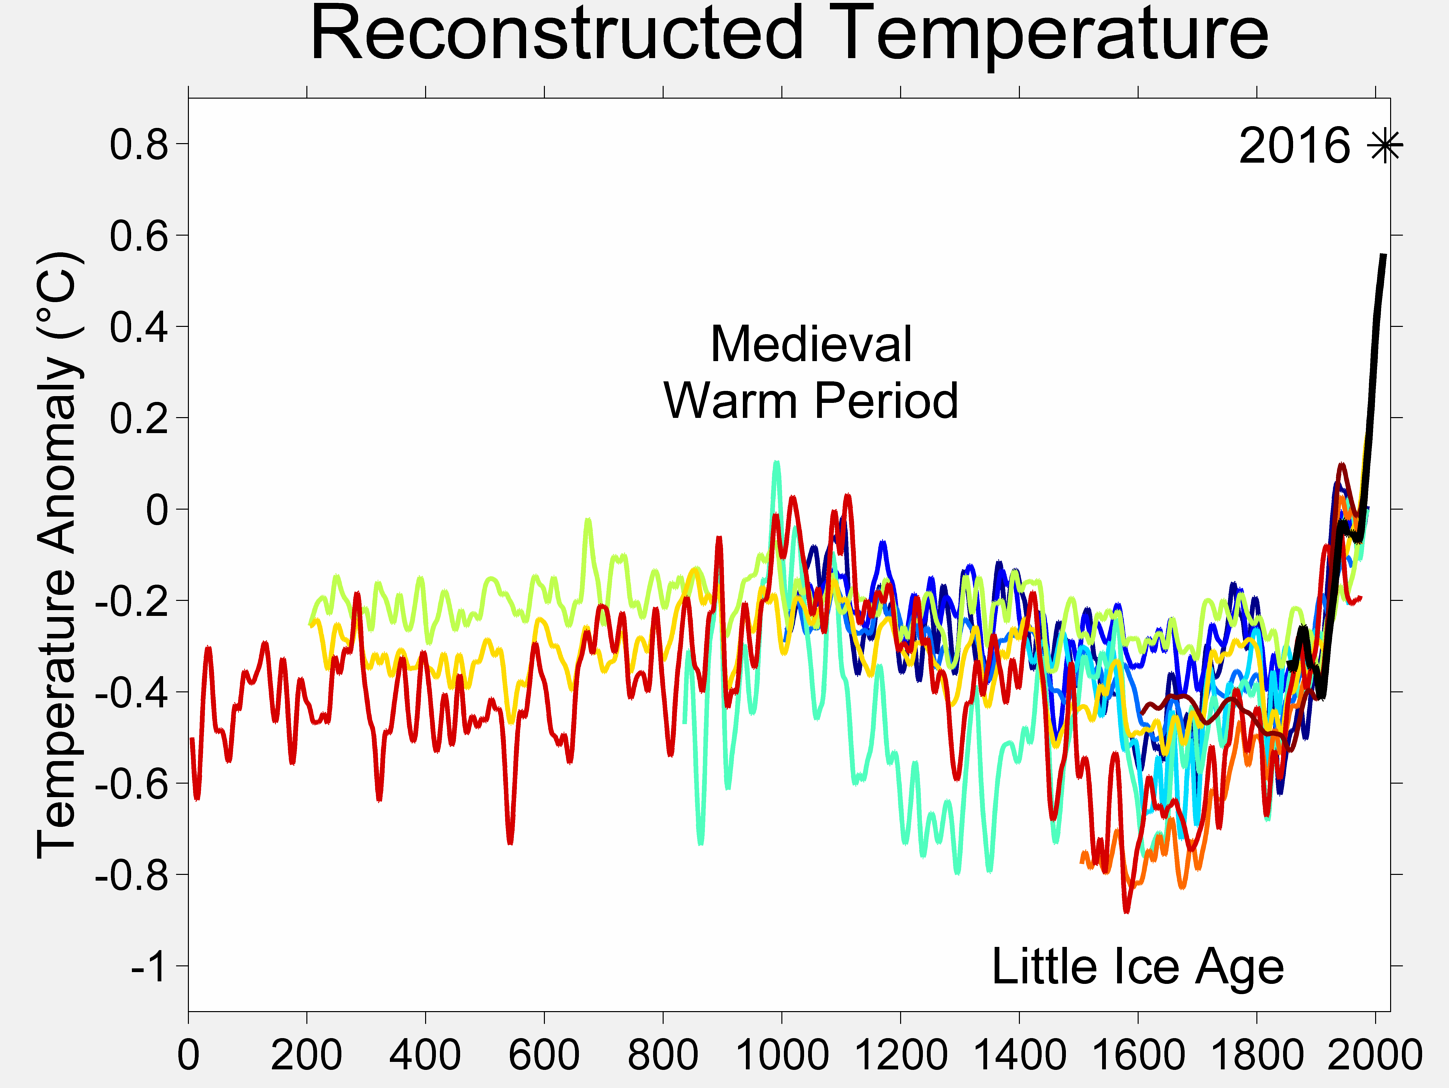
Still such proxies are useful. And for CC there are many proxies which all sort of indicate climate. I’m not sure if they control for some other factors (aside from temp) for trees or other proxies, but here is a chart of several proxies that are used for climate (the black line at the end is the instrumental data), with the Wiki article discussing several of them at en.wikipedia.org/wiki/Proxy_(climate.


My point was that after the 1960s the tree ring proxy was not useful – falling well below the instrumental data (though it had been tracking it fairly well earlier) – and that might be because of the GH effect type of warming we are experiencing nowadays, with the more greatly increasing night temps being harmful to plants and perhaps trees.

Another interesting thing is that the winter climate is warming faster than the summer climate.

I know that is very bad for certain fruit-bearing trees like apple and cherry. They need cold winters in order to produce their fruit in summer. A friend of ours in Germany complained one year about her apple tree not bearing apples, while in another context she had spoke of the unusually warm winter they had had, so I explained it may be due to that very warm winter they had.
 
Status
Not open for further replies.
Back
Top