Scientist: Forget Global Warming, Prepare for New Ice Age

  • Thread starter Thread starter b_justb
  • Start date Start date
Status
Not open for further replies.
The short version, to me, sounds like “Humans are preposterously arrogant to think they have even 10% of the knowledge and comprehension necessary to project future climate trends. As usual with computers, GIGO.”
Here’s a way to test that assumption. I predict the next five years will be, on the average, warmer than the last five.

In five years we will know. If not, I will announce to all on this board that I was mistaken, and the climate trends of the past few decades were not good indicators of future climate. If it happens, you will announce that you were wrong, and we do indeed have adequate data to project a continuing warming trend.

Wanna bet?

BTW, all studies I see show that upper-atmosphere temperatures are not well correlated with atmosphere at ground level.
 
Well, 1998 was suppossed to be the hottest year on record, except it was based upon flawed data and the 1930s was warmer…and we’ve not been has warm since then…so it’s been 10 years, not 5…case dismissed.
 
Well, 1998 was suppossed to be the hottest year on record, except it was based upon flawed data and the 1930s was warmer…
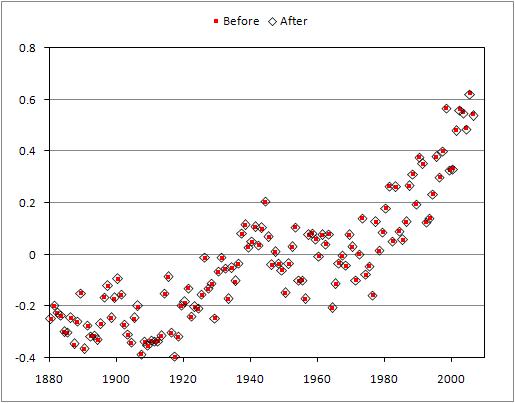
Let’s look at the corrected data, then…


tamino.wordpress.com/2007/08/12/before-and-after/
As you can see, the corrected data isn’t much comfort to you, either. And you were snockered by someone about the 1930s being warmer than recently.
…case dismissed.
Yep, but not the way you were hoping for. BTW, I don’t blame you for dodging my challenge. If I had your side, I wouldn’t take it, either.
 
**The recently-discovered corrections apply only to some stations in the U.S., and the claim that “1934 is now the hottest year on record” applies only to the lower 48 states of the continental U.S. Before the recent correction, for the lower-48 U.S. states the years 1998 and 1934 were too close to call — a “statistical tie” — with 1998 having the slightly higher numerical value. After the recent correction, for the lower-48 U.S. states the years 1998 and 1934 are too close to call — a “statistical tie” — with 1934 having the slightly higher numerical value.

Yet most denialist bloggers simply state that 1934 is now the hottest year on record — with no qualification given that this applies to the lower-48 U.S. states, not to the globe. The lower-48 of the U.S. make up less than 2% of the area of the globe. What is the impact on global average temperature? What’s the hottest year on record — globally — after the correction? Let’s take a look.**
tamino.wordpress.com/2007/08/12/before-and-after/

Is this another example of the way deniers play bait-and-switch by claiming to talk about global data, and then presenting local temperature data?

You betcha.
 
Barbarian, no info on the Aqua findings? Note I didn’t discuss TEMPERATURE in the upper atmosphere, but water vapor concentrations.

Your challenge, like most of the AGW bandwagon folks, presumes that proving a short term warming trend inherently proves that it was caused by human activity. Definition of non sequitor.

Another honest question. I’ve never heard a plausible rebuttal for Michael Crichton’s criticism of the global temperature records being unduly influences by local ‘urban heat islands.’ According to his hypothesis, the population correction used by the IPCC to account for heat island effect is severly flawed since heat island isn’t caused by the number of PEOPLE, but by the development footprint they create. In the last hundred years, the acreage of roofs, asphalt and turf lawns per capita has grown enormously! These land covers absorb a LOT more heat than native prairie and forest ground covers ever did. Would you happen to have any links to resources that discuss this issue?

It would sure be a shame if we focused enormous human energy and money and CO2 on trying to fix the problem only to find out later that parking lots skewed the data and the real warming trend was not particularly threatening.
 
Note I didn’t discuss TEMPERATURE in the upper atmosphere, but water vapor concentrations.
We’re discussing temperature trends in the atmosphere at the surface. If you think it invalidates the data somehow, feel free to show us. The idea that more cloud cover can compensate for warming is probably true, but so far, we haven’t reached equillibrium. So there will have to be a lot more cloud cover, and that at higher temperatures than we have now, before the decrease in solar flux will balance the increase in greenhouse effect. At least I hope it will happen; the alternative is a runaway effect, which I think is highly unlikely, but which would be truly catastrophic. The problem is that solubility of water in air depends on temperature. And water vapor is itself an effective greenhouse gas.
Your challenge, like most of the AGW bandwagon folks, presumes that proving a short term warming trend inherently proves that it was caused by human activity.
No, it is a simple prediction. The next five years will be warmer than the preceding five years. Very precise and direct, with no cause mentioned. The reason no denier will take the challenge is that they have mostly realized that the next five years will indeed be warmer. You for example, seem to realize that it would be unwise to pick up the gauntlet. And, to be fair; I know what’s going to happen, so I’m not really risking anything.
Another honest question. I’ve never heard a plausible rebuttal for Michael Crichton’s criticism of the global temperature records being unduly influences by local ‘urban heat islands.’
Essentially he’s saying “this is unfair; there are more cities and urban areas, and those are hotter than countryside, so it shouldn’t count.”

If you can’t see what’s goofy about this, I’ll explain it to you. Do I need to? Crichton, BTW, also apparently believes that science doesn’t proceed by consensus, another amazingly strange claim. There is no official science position; a theory is considered settled when most people in the field accept it.
According to his hypothesis, the population correction used by the IPCC to account for heat island effect is severly flawed since heat island isn’t caused by the number of PEOPLE, but by the development footprint they create. In the last hundred years, the acreage of roofs, asphalt and turf lawns per capita has grown enormously! These land covers absorb a LOT more heat than native prairie and forest ground covers ever did.
I suppose that might partially explain why the IPCC estimates of global warming were somewhat low; a lot more heat was being generated by these structures than might be estimated from the number of people. But doesn’t this undermine your argument?
Would you happen to have any links to resources that discuss this issue?
Doesn’t seem to be a problem, but if you think it’s really warming things more than models suggest, I’ll take a look.
It would sure be a shame if we focused enormous human energy and money and CO2 on trying to fix the problem only to find out later that parking lots skewed the data and the real warming trend was not particularly threatening.
Interesting idea, but urbanization always means a large increase in CO2 being generated. So the correlation isn’t necessarily an indication of causation. Moreover, the same things that reduce CO2, would reduce the amount of new cities, factories, etc.

The question is not whether or not it’s a problem, it’s whether or not we have the will and the economic wherewithall to do something about it.

 
"Essentially he’s saying “this is unfair; there are more cities and urban areas, and those are hotter than countryside, so it shouldn’t count.”

If you can’t see what’s goofy about this, I’ll explain it to you. Do I need to? " The Barbarian

I don’t think you follow his hypothesis. Let me try again. The temperature gage station distribution is not even across the earth. Many of the historic global temperature gage stations are clustered within the current influence of urban heat islands. Thus, these stations tend to skew the mean temperature estimates upwards compared to what the readings would be if gage stations were evenly distributed on the planet (including wilderness areas). Don’t argue with me because the IPCC agrees, recognizes the truth of this and corrects gage station readings based on population. They assume that the local gage skew upwards is directly proportional to population. The higher the population, the more they reduce the reading to compensate for the local effect.

But population is NOT the issue generating urban heat island. Land use is. Asphalt gets HOT in the sun and gages downwind of a lot of it show a difference. Land use is expensive to measure, but population figures are readily at hand (cheap). The heat generating land covers of cities have in recent decades NOT been proportional to population. More like exponential (heard of urban sprawl?). Thus there is a double whammy: gage stations being clustered around urban areas overestimate the regional average temperatures and the correction applied by the IPCC grow less and less accurate from the 1940s to today because of sprawl. It is a IMO scary difference that the departure in precision of the IPCC corrections directly corresponds with the ‘hockey stick’ so vaunted by CO2 alarmists.

My point is that everybody wants to focus on CO2, but the evidence seems just as strong that we have a warming trend that is smaller than we think and more easily corrected. Hybrid cars, electric cars, windmills, solar and the stuff in vogue would do NOTHING to reduce urban heat islands. It would actually be a nearly nominal cost to require dense tree plantings in residential neighborhoods, use reflective concrete instead of black asphalt in parking lots, install vegetated green roofs on buildings with flat roofs and light colored roofing on smaller ones. Many in the development business are starting respond to this call, but progress has been badly slowed because all the ‘green’ emphasis is on CO2.
 
Let me try again. The temperature gage station distribution is not even across the earth. Many of the historic global temperature gage stations are clustered within the current influence of urban heat islands. Thus, these stations tend to skew the mean temperature estimates upwards compared to what the readings would be if gage stations were evenly distributed on the planet (including wilderness areas). Don’t argue with me because the IPCC agrees, recognizes the truth of this and corrects gage station readings based on population. They assume that the local gage skew upwards is directly proportional to population. The higher the population, the more they reduce the reading to compensate for the local effect.
That won’t work for you, either. Where sprawl is most common (the United States) warming is least apparent. This is is why the deniers tried to conflate warming in the US with global warming. So this theory immediately crashes on the fact that warming is least apparent where the effect is the greatest.
My point is that everybody wants to focus on CO2, but the evidence seems just as strong that we have a warming trend that is smaller than we think and more easily corrected. Hybrid cars, electric cars, windmills, solar and the stuff in vogue would do NOTHING to reduce urban heat islands.
Quite the contrary. Reducing CO2 in America would reduce development. It’s the best practical objection against Kyoto. It would slow growth.

But it’s a moot point. The effect doesn’t match the data.

My offer stands, BTW:
Here’s a way to test that assumption. I predict the next five years will be, on the average, warmer than the last five.

In five years we will know. If not, I will announce to all on this board that I was mistaken, and the climate trends of the past few decades were not good indicators of future climate. If it happens, you will announce that you were wrong, and we do indeed have adequate data to project a continuing warming trend.

Wanna bet?
 
Let’s look at the corrected data, then…

http://tamino.files.wordpress.com/2007/08/befaft.jpg
tamino.wordpress.com/2007/08/12/before-and-after/
As you can see, the corrected data isn’t much comfort to you, either. And you were snockered by someone about the 1930s being warmer than recently.

Yep, but not the way you were hoping for. BTW, I don’t blame you for dodging my challenge. If I had your side, I wouldn’t take it, either.
Except that this data is NOT corrected…how many of the temperature gauges are actually installed in heat islands???hmmmm?

I’d also like to suggest that you not site web sites that favor the mistaken view that global warming, if it’s occuring, is caused by humans as “proof.”
 
Except that this data is NOT corrected…
Yep, that’s it. They told you it was a huge error, um? It wasn’t. It was a statistical glitch, and it didn’t amount to very much. That’s the error they were talking about.
how many of the temperature gauges are actually installed in heat islands???hmmmm?
I’d certainly be open to your checkable evidence that this was a significant factor. As you know, the “heat island” issue seems to exist mostly in the US, which actually has shown less heating than the rest of the world. That pretty much eliminates the “heat island” story as a factor.
I’d also like to suggest that you not site web sites that favor the mistaken view that global warming, if it’s occuring, is caused by humans as “proof.”
That would be a rather hard thing to do, if I wanted to post data. The scientific community, as you know is overwhelmingly convinced by the data that it’s a fact.

If I used only “true believer” sites that deny global warming, it would be almost impossible to get raw data or an accurate picture of scientific consensus.

And the true believers won’t tell you this: (possibly because they don’t know about it)

**This derived error bar only addressed the error due to incomplete spatial coverage of measurements. As there are other potential sources of error, such as urban warming near meteorological stations, etc., many other methods have been used to verify the approximate magnitude of inferred global warming. These methods include inference of surface temperature change from vertical temperature profiles in the ground (bore holes) at many sites around the world, rate of glacier retreat at many locations, and studies by several groups of the effect of urban and other local human influences on the global temperature record. All of these yield consistent estimates of the approximate magnitude of global warming, which has now increased to about twice the magnitude that we reported in 1981. Still further affirmation of the reality of the warming is its spatial distribution, which shows largest values at locations remote from any local human influence, with a global pattern consistent with that expected for response to global climate forcings (larger in the Northern Hemisphere than the Southern Hemisphere, larger at high latitudes than low latitudes, larger over land than over ocean).

Some improvements in the analysis were made several years ago (Hansen et al. 1999; Hansen et al. 2001), including use of satellite-observed night lights to determine which stations in the United States are located in urban and peri-urban areas, the long-term trends of those stations being adjusted to agree with long-term trends of nearby rural stations. **
NASA

It seems the problem is old news and not an issue. Even more interesting, the patterns persist in windy days, which makes no sense if “heat islands” were a factor.

But feel free to show us contrary data, and we can see what the actual scientific observations match up with.
 
Well, 1998 was suppossed to be the hottest year on record, except it was based upon flawed data and the 1930s was warmer…and we’ve not been has warm since then…so it’s been 10 years, not 5…case dismissed.
This is true of US temperatures, not global ones. The error was in the computation of US temps by GISS. The changes were fairly small but they did have a large affect on the way US temps were described since it could no longer be said that (e.g.) eight of the ten hottest years on record were in the last decade. It also seems a bit inappropriate that GISS won’t release either the raw temperatures or the algorithm used to adjust them. There may be nothing in this but I see no reason why requests for this information should have been refused.

What is intriguing is the correlation between US and global temps; the two graphs don’t look much like one another. I don’t know what that means but it seems a bit odd.

(Look at the charts at the bottom of the page under Data Flaw.)

data.giss.nasa.gov/gistemp/2007/

Ender
 
Meanwhile, south of the equator, they are experiencing record low temps. Veddy strange.
 
Well, not quite, although La Nina did manage to keep it lower than it could have been…

2007 was warmer in the Northern Hemisphere, where the year ranks second warmest, than the Southern Hemisphere, where it ranks ninth warmest," said Phil Jones, a climatologist at the University of East Anglia in England. “The year began with a weak El Nino — the warmer relation of La Nina — and global temperatures well above the long-term average. However, since the end of April the La Nina event has taken some of the heat out of what could have been an even warmer year”.
“southern hemisphere” “hottest years”

Smaller area, smaller sample. Less reliability as to the overall trend. Basic statistics.

I take it we aren’t going to see that data any time soon?
 
This past weekend, Lawrence Solomon was on BookTV discussing his new book, “The Deniers”.

Excellent presentation and discussion.

His presentation can be viewed on www.booktv.org for another week or so.
 
Thanks Barbarian, your responses have been helpful and informative. Not that I’m convinced we need the civilizational realignment the AGW folks demand, mind you. But I’m pleased these issues are being looked at and I’m glad there are smart people on both sides of the issue duking it out.

I would suggest you not use your challenge in arguments though. It is a total bait and switch game that discredits your otherwise admirably supported posts. Climate goes through trends. A warming trend does NOT prove it is caused by CO2 levels. Your challenge makes it sound like you don’t see that possibility.
 
I would suggest you not use your challenge in arguments though. It is a total bait and switch game that discredits your otherwise admirably supported posts. Climate goes through trends. A warming trend does NOT prove it is caused by CO2 levels. Your challenge makes it sound like you don’t see that possibility.
I appreciate your concern, and the spirit in which it was offered. But this is the way science works. A theory (anthropogenic global warming) makes predictions. Conflicting theory ( it’s not getting warmer) makes a conflicting prediction.

Then we go out and test them.

Now, it’s possible that the theory might be refined to say “sure it’s warming, but it’s the sun doing it.” We can test that, too. If that’s true, all the planets should be warming up. But Pluto’s atmosphere is getting colder. There’s not a uniform warming trend in planets.

The best possible way to test theories, is to see if their predictions are validated.

BTW, the “civilizational alignment” will take place, even if governments don’t get involved. Economic realities will eventually make it happen.

I believe that it will have to happen that way for two reasons:
  1. I distrust governments to work in a consistent and rational way.
  2. We lack the will to make the sort of choices required, unless we are forced by circumstances to do so.
 
Another issue is the role of IPCC …

Everything IPCC cites is true. What it is is advocacy, which means only citing that which supports your case, and giving that the most supportive possible interpretation. One could do the same thing with the science, because the science is mixed.

There are lots of voices screaming that the IPCC ignored valid science. For example: john-daly.com/guests/un_ipcc.htm

Most of the published AR4 review comments screamed about this bias. So have hundreds of articles.

www.thewashingtonpest.blogspot.com

and scroll down to:

and scroll down to: 2007/02/ipccs-artful-bias

February 3, 2007.

In addition to ignoring valid science there is the matter of interpretation.

Remember, the IPCC is interpreting the science, not reporting it or doing it. Here is an example. The IPCC either ignores the MWP-LIA cycle or says it does not exist. The latter is a questionable interpretation. The science does not say one way or the other. The science merely presents evidence both ways. Then the IPCC interprets that evidence to dismiss the MWP-LIA, by ignoring the evidence for it. Is this lying or advocacy?

An honest assessment would say the evidence is mixed. The IPCC does not. This pattern is repeated at very step of the AGW argument. The dishonesty is more subtle than lying. It is a system of half truths and false confidence.

The above was based on posts on www.climatechangedebate.com
 
Actually, what a few bloggers say about a climate organization has nothing whatever to do with the fact of global warming.

If you think the evidence is mixed, why not take me up on my challenge?

That would mean you’d have at least an even shot at winning, um?
 
Status
Not open for further replies.
Back
Top