World's climate warming faster than feared, scientists say

  • Thread starter Thread starter gilliam
  • Start date Start date
Status
Not open for further replies.
CO2 can’t be both feedback and forcing at the same time. I’m detecting some real contortions here being created to “prove” the MM argument. Basic physics says you can’t have it both ways.
Let me explain:
  1. CO2 is well accepted as a “forcing” – that is based on the laws of physics and the fact that CO2 molecules stay up much longer in the atmosphere than, say, H2O molecules. Without the natural greenhouse effect (mainly composed of CO2), which makes the earth about 33C warmer than it would be without it, life on earth would not be possible. This is well-accepted science.
  2. CO2 can be a feedback in this way: Warmth melts ice. There is a lot of methane and some CO2 which is trapped in ice – in the bottom of oceans in clathrates (or hydrates), and on land in permafrost, such as in the arctic area. As it gets warmer in these areas the ice melts and this methane & CO2 are released. Methane, itself a powerful GHG, degrades into CO2, which has much longer residence in the atmosphere.
 
Dear Lynn and Leaf: Too much tail chasing here. Let’s stop going in circles and deal with something simple. Answer this. What percentage of all the greenhouse gases are caused by mankind?
 
Dear Lynn and Leaf: Too much tail chasing here. Let’s stop going in circles and deal with something simple. Answer this. What percentage of all the greenhouse gases are caused by mankind?
That is not a relevant question. The reason it is not relevant is that the greenhouse gasses that are not caused by mankind have been relatively stable for the last few thousands of years, and their effect is in balance. We have achieved an equilibrium or sorts with these effects. But add more CO2 and that equilibrium will be upset.
 
Dear Lynn and Leaf: Too much tail chasing here. Let’s stop going in circles and deal with something simple. Answer this. What percentage of all the greenhouse gases are caused by mankind?
I’m guessing nearly 30% of the CO2 in the atmosphere is human-caused (see below).

Another answer to the Q of what percentage of all the GHGs are caused by humans: Enough to be the main cause for the current level of warming (about 0.8C, which may reach 2.4C once equilibrium is reached – see below). Other GHGs (at this point*****) are in a natural back and forth flux. Plants take in CO2 (during photosynthesis), animals (and plants at night) breath them out.

The natural GH effect keeps the earth warm enough for life to exist. That is surely the most abundant level of GHGs, because it keeps the earth warmed about 33C more than it would be without those gases. (However, note that the function of CO2 causing warming is a log function, not a straight line, so that initial amount of 280 ppm has the biggest warming effect…of about 33C.)

The important “forcing” GHG is CO2, since it is more abundant and has a longer residence in the atmosphere than CH4 (partly from natural gas leakage, livestock, and paddy fields, etc) and NOx (partly from auto emissions, synthetic fertilizers, etc). The other GHGs, human-produced chemicals, tho quite potent GHGs, are not in such a vast quantity as CO2. H2O is a potent GHG and is more abundant than other GHGs, esp with the warming, but it is a “feedback” to these forcing GHGs – more of it goes into the atmosphere due to the warming, so in effect a portion of that water vapor in the atmosphere was put there by the warming which humans caused. That portion is to be figured in GHGs “caused by humans.”

CO2 in the atmosphere has gone from about 280 ppm in pre-industrial times to currently 400 ppm (see co2now.org/Current-CO2/CO2-Now/ ) – that’s about 120 ppm more – which would come out to about 30% of the present 400 ppm is mainly from human emissions.

From what I have read, the current amount of CO2e (including the other GHGs) would cause the earth to warm (high-end projection) about to about 2.4C above pre-industrial levels once it all plays out (there is a lag time between emissions and warming), assuming there are no further GHG emissions, which is a wrong assumption.

*****Once the climate reaches 2 or 3C warmer, this will cause vast releases of CH4 stored in hydrates and permafrost (it’s already happening to some extent) – and tho CH4 has a shorter residence in the atmosphere, about 10 years, it degrades into CO2+ – after which temps will continue to rise along with increasing emissions from “nature” until we get to 6C warmer in 100 to 200 years, and perhaps even 10C warmer thereafter in centuries and millennia to come. This would most certainly kill off much of life on earth, including humans. Such warming and its knock-on effects during the end-Permian 251 mya killed off about 95% of life (tho life then was less resilient than today).

The ideal ppm of CO2 top climate scientists tell us to avoid this nightmarish scenario is 350 ppm. This means we need to reduce our GHG emission enough to allow nature to absorb more CO2 than is being emitted, until we can get it down to 350 ppm or less. It’s getting to be more and more difficult for that to happen, however, with all the wildfires, droughts, floods, and ocean acidification (increased by AGW) reducing plant-life on earth, it seems faster than CO2 fertilization can help plants grow more.

So I guess eventually as nature releases vast gigatonnes (perhaps teratonnes) of carbon (CH4, CO2) as a response to the increasing warming, skeptics can rest assured that the portion of directly human-caused GHGs in the atmosphere will not be very great compared to the GHGs under the natural GH effect plus those added from melting hydrates and permafrost.

 
So I guess eventually as nature releases vast gigatonnes (perhaps teratonnes) of carbon (CH4, CO2) as a response to the increasing warming, skeptics can rest assured that the portion of directly human-caused GHGs in the atmosphere will not be very great compared to the GHGs under the natural GH effect plus those added from melting hydrates and permafrost.
What warming?
 
What warming?
Bob, I am reading a history book on the Black Death, written in 1983. In it, the author talks about the Medieval Warming Period and how the weather was warmer and drier than in the Dark Ages. During this warming period, crop production and yields became high enough to cause surpluses. This allowed people some leisure. Towns and villages began to flourish, as well as trade in “luxuries” such as spices and textiles. In about 1330, the climate turned wetter and cooler. Several periods of crop failures ensued, causing widespread famine. Crop yields dropped. These famines weakened population, making them especially vulnerable to the ravages of the plague, which decimated the population.
 
40.png
St_Francis:
And what do we know about these changes in ocean currents? Or are they simply assumed so as to explain the odd anomaly of same-temp water warming deeper water more?

You need to provide a *reasonable *possibility…
It is reasonable. Any increase in the mixing between surface water and deeper water would have the simultaneous effect of increasing deep water temperature and cooling surface water (because it is mixing with water from the cooler deep). Then the increased global warming replaces that lost heat in the surface water so that it ends up relatively stable. The idea that there in increased mixing due to changes in climate is not that far fetched.
Not at all. If the slightly deeper water is now warmer, and the more deep water is also warmer (from underwater action which we *know *exists), then we might assume that the normal sort of thing has happened: that lower warmer water warmed the higher water, not that shallow upper water whose temp has not changed.
Where in the oceans (except around volcanic vents) do you find warmer lower water and cooler higher water? It just doesn’t happen. The deep water, on average, is always cooler. So it cannot possibly warm the shallower water.
Opaque? So the heat all escapes on those clear nights when one can see so many stars?
I said that clouds are opaque, clear nights are not. And that’s when more heat escapes.
Oh, so what do the AGWPs know about what is escaping?
It can be estimated by looking at the earth from the outside (by satellite). The IR radiation from the earth can even be measured directly. Or it can be inferred by measuring the percentage of ice and snow coverage and comparing it with the earliest satellite photos. There is nowhere the escaping energy can hide from these sensors.
 
What warming?
Check out the global average temps after 1990. Not one of them drops down to the 1975 or earlier levels. Also note that there is a up and down, even in the 5-year running average. That is not in any way a surprise to climate scientists – they never expected a strictly increasing warming, due to the many factors impacting CC.

http://blogs.discovermagazine.com/imageo/files/2013/05/Land-Ocean-Temperature-Index.gif

The other issue is that this graph only reflects the land-ocean temps, but only the ocean to a certain depth. What scientists did find that sort of surprised them is that some of that ocean warmth it doing down deeper, so in effect there actually has been warming over the past 17 years. But even if there had not been, it would not have surprised scientists.

Check this out: “The answer is blowing in the wind: The warming went into the deep end” at realclimate.org/index.php/archives/2013/04/the-answer-is-blowing-in-the-wind-the-warming-went-into-the-deep-end/comment-page-5/?wpmp_switcher=mobile&wpmp_tp=1

This means we’ll likely be seeing more warming at the scientific level of significance in the near future…then again after some time, a dip or flattening out, followed by significant warming again, and so on.

Think of a jagged saw blade, but tilted upward. That is what is expected, not a straight line.

Also the warming may be slow and stagnating or dipping now and then to you’ll, but it is actually quite rapid when compared to other warmings in the past – doesn’t give nature or us much time to adjust, considering how we are feet-dragging, kicking and screaming all the way, refusing to become more energy/resource efficient/conservative or get on to alt energy, or raise our levees and hurricane- and storm-proof our structures, etc.
 
Bob, I am reading a history book on the Black Death, written in 1983. In it, the author talks about the Medieval Warming Period and how the weather was warmer and drier than in the Dark Ages. During this warming period, crop production and yields became high enough to cause surpluses. This allowed people some leisure. Towns and villages began to flourish, as well as trade in “luxuries” such as spices and textiles. In about 1330, the climate turned wetter and cooler. Several periods of crop failures ensued, causing widespread famine. Crop yields dropped. These famines weakened population, making them especially vulnerable to the ravages of the plague, which decimated the population.
That’s also expected in northern latitudes that up to around 2050 crops will be doing better due to CC and carbon fertilization – tho not in some poor areas around the world where they are and will be doing worse. However after 2050 when it really gets a lot hotter than the MWP and we leave the Holocene and enter the Anthropocene, it is expected crops will have a sharp decline in productivity due to CC.

See:
Lobell, D. B., W. Schlenker, and J. Costa-Roberts. 2011. “Climate Trends and Global Crop Production Since 1980.” Science 333(6042): 616-620.
and
Schlenker, W., and M. Roberts. 2009. “Nonlinear Temperature Effects Indicate Severe Damages to U.S. Crop Yields under Climate Change.” Proceedings of the National Academy of Science. 106(37): 15594-15598.
If the models are correct.
 
As pointed out earlier in the thread, if the graph does not indicate the percentage of error in the measurements, it is dishonest.

I would suggest that less deceptive and dishonest evidence could be found if man made climate change actually existed.
I’ve seen graphs with the margins of error and those are not so much as to derail the trend in warming. I just can’t find one right now off the bat. I do have a demanding job and can’t spend too much time here. If I happen to come across one, I’ll share it here.

You have to remember that these global average temps (in the graph I posed) are based on instrumental data, so the margins of error will be quite tiny compared to those based on proxies. Unless you think thermometers used at weather stations are just a bunch of bunk that do not give very accurate readings.

The other issue is that errors would likely not be “biased” in one direction or the other, so for the most part they’d be cancelling each other out.

Look up the Berkeley Earth Surface Temperature project (BEST), created by skeptic who had similar concerns to yours, highly suspicious of the data. They got a high level of funding mainly from skeptics like the Koch brothers and did their own analysis and found the climate scientists’ findings to be accurate and their projections into the future even to underestimate the problem. To which the climate scientists pointed out that BEST’s projections were higher bec they did not account for various important factors. Which is to be expected, since BEST’s team are NOT climate scientists, but physicists.

See: en.wikipedia.org/wiki/Berkeley_Earth
 
As pointed out earlier in the thread, if the graph does not indicate the percentage of error in the measurements, it is dishonest.

I would suggest that less deceptive and dishonest evidence could be found if man made climate change actually existed.
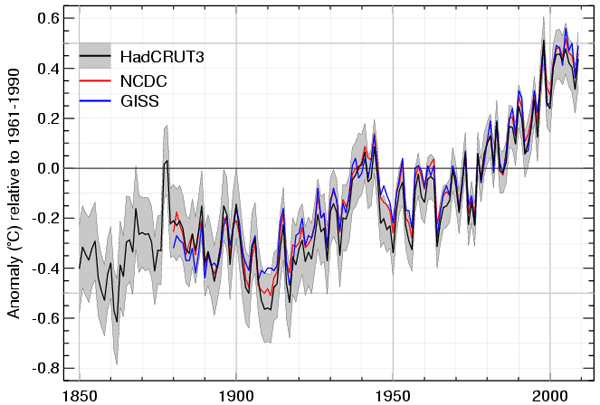
This graph seems to have margins of error and also shows 3 different data sets (using different methods) and they all pretty much jive:

 
They all show no warming for 18 years in spite of a significant increase in CO2. Not one single global warming advocate scientist predicted this. Not one.
Please explain why this is significant. How is it necessary that they predict this particular pattern in order to be taken seriously for what they do say?
 
Please explain why this is significant. How is it necessary that they predict this particular pattern in order to be taken seriously for what they do say?
Because the whole global warming myth was based on the supposed fact that increase in CO2 cause the atmosphere to warm. Evidently that is not true.
 
It would be a lot easier to convince me if there were some warming taking place.
🤷

One day you will have to open your eyes. You are definitely free to believe anything you wish, but all humanity shares one mother, EARTH. And people need to wake up and help protect her before it’s too late.

Please here is a CONSENUS from NASA:

climate.nasa.gov/scientific-consensus/

Does this NOT convince you even in the slightest? I mean just a little bit? What do you think about it? A huge conspiracy? Please enlighten us.
I have no need to enlighten you. The theory was that rising Co2 cause increased atmospheric temperature. That has proven to be false. ALL the models were wrong. I see no reason to disrupt the economies of countries to mitigate a myth.
 
They all show no warming for 18 years in spite of a significant increase in CO2.
This is to be expected. Just look at the line before 2000, quite wobbly indeed. There is a long lag time between GHGs entering the atmosphere to the full extent of their warming potential. In fact, some scientists say there is about 2.4C warming “in the pipes” from the current levels of GHGs that will take some decades to play out.

Climate scientists have NEVER said the actual observational line would be strictly increasing (even if some have drawn somewhat straight projection lines). Climate scientists know, as we all who are interested in the topic should know, that there are many factors that determine global climate, including short-term (usually about 11 year) solar irradiance fluctuations. It just so happens we are now pulling out of a longer and deeper solar minimum (which you rightly point out the scientists did not predict). I imagine the temps will start an upward movement soon (in a few years, if not sooner), to the satisfaction of all the skeptics who keep hammering this strawman to smithereens.

Check out this graph (which I have posted at CAF over and over again) – see how the temps up until the 80s pretty much tracked solar irradiance fluctuations, but then took off upward in the 80s. IF there were no GW, then one would have expected the temps over the past 15 years to have taken a nose-dive down to pre-1970s temps or lower.

http://www.skepticalscience.com/graphics/Solar_vs_temp_500.jpg

While this short term solar cycle helps explain the jagged saw-tooth nature of global average temps year-to-year over the years and decades, this recent deep and long solar minimum has not stopped the warming, which has actually been significantly increasing over the past 17 years if one looks at earth’s total energy imbalance.

It has been found that the deeper ocean is uptaking more heat than expected rendering the land and sea-surface temps (which are used in the regular temp datasets to determine global average temps) somewhat lower than expected. So you are absolutely right, the climate scientists didn’t expect that.

There are a few things left to be discovered in science…

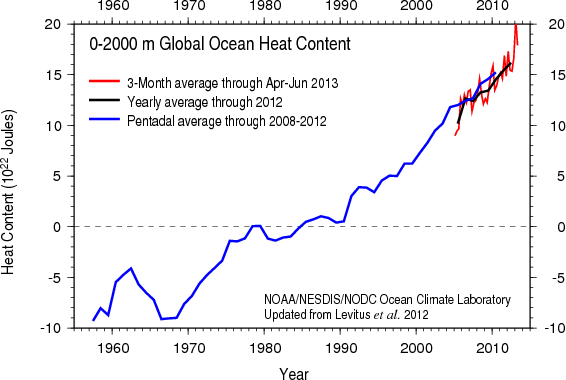
Here’s a graph for increasing ocean heat content:


And a discussion for “The heat content of the oceans is growing and growing. That means that the greenhouse effect has not taken a pause and the cold sun is not noticeably slowing global warming”: realclimate.org/index.php/archives/2013/09/what-ocean-heating-reveals-about-global-warming/
 
This is to be expected. Just look at the line before 2000, quite wobbly indeed. There is a long lag time between GHGs entering the atmosphere to the full extent of their warming potential. In fact, some scientists say there is about 2.4C warming “in the pipes” from the current levels of GHGs that will take some decades to play out.

Climate scientists have NEVER said the actual observational line would be strictly increasing (even if some have drawn somewhat straight projection lines). Climate scientists know, as we all who are interested in the topic should know, that there are many factors that determine global climate, including short-term (usually about 11 year) solar irradiance fluctuations. It just so happens we are now pulling out of a longer and deeper solar minimum (which you rightly point out the scientists did not predict). I imagine the temps will start an upward movement soon (in a few years, if not sooner), to the satisfaction of all the skeptics who keep hammering this strawman to smithereens.

Check out this graph (which I have posted at CAF over and over again) – see how the temps up until the 80s pretty much tracked solar irradiance fluctuations, but then took off upward in the 80s. IF there were no GW, then one would have expected the temps over the past 15 years to have taken a nose-dive down to pre-1970s temps or lower.

http://www.skepticalscience.com/graphics/Solar_vs_temp_500.jpg

While this short term solar cycle helps explain the jagged saw-tooth nature of global average temps year-to-year over the years and decades, this recent deep and long solar minimum has not stopped the warming, which has actually been significantly increasing over the past 17 years if one looks at earth’s total energy imbalance.

It has been found that the deeper ocean is uptaking more heat than expected rendering the land and sea-surface temps (which are used in the regular temp datasets to determine global average temps) somewhat lower than expected. So you are absolutely right, the climate scientists didn’t expect that.

There are a few things left to be discovered in science…

Here’s a graph for increasing ocean heat content:
http://www.realclimate.org/images//heat_content2000m.png

And a discussion for “The heat content of the oceans is growing and growing. That means that the greenhouse effect has not taken a pause and the cold sun is not noticeably slowing global warming”: realclimate.org/index.php/archives/2013/09/what-ocean-heating-reveals-about-global-warming/
And we have already shown, via your own “experts” that heat transfer goes from the oceans to atmosphere not the other way around. So the increase in ocean temps cannot be from increasing atmospheric temperatures (especially since the atmosphere hasn’t warmed in 20 years).
 
Status
Not open for further replies.
Back
Top